Economic Rebalancing

The global economy is horribly out of balance, with the United States going deeper into debt each year as a result of a huge trade gap. This blog describes the process of global economic rebalancing. If you have any comments or questions about the posts here, please don't hesitate to use the comments section.

Sunday, April 29, 2007

The Carry Trade and the Supply of Japanese Yen

Money is created by banks when people borrow it into existence. In the US, there are no shortage of people wanting to borrow money for consumption or investment. In Japan finding borrowers is a bit problamatic because, culturally speaking, the Japanese are very good savers. The Japanese government has done it's part in running up huge debt until recently:


In June 2003, with the Fed cutting interest rates to an ultra-low 1.00%, and deflation remaining a real problem in Japan, the Bank of Japan went wild printing Yen and buying dollars. This forced the Yen down and boosted Japanese manufacturing, allowing the the BoJ to ease off. Since then the BoJ has wisely been selling US treasuries and soaked up much of the liquidity they had added to fight off deflation:


More recently, I believe foreign carry-traders are behind much of the borrowing that has kept deflation from taking hold in Japan. In June of 2004, the Fed began raising US interest rates from 1.00% all the way up to 5.25% two years later. With each hike, the value of the dollar was boosted relative to the Yen because of the Yen carry trade became much more attractive. As more carry traders borrowed Yen and purchased US dollars or other currencies it helped expand the Japanese money supply.


The carry trade is serving the policy needs of the BoJ and Japanese government very well for now. With each new Yen borrowed into existence, it stimulates the Japanese economy. Japanese exporters have an easy time unloading the dollars they receive from American consumers and Japanese bankers profit from interest payments on the money they create and loan.

On the American side, Wall Street is making a killing off of the easy short term gains. Bonuses for investment bankers are at an all time high. Unfortutely the profits are mostly temporary. The carry trade is so large that it cannot be unwound successfully for most participants (who are mainly hedge funds). The Bank of Japan will be in control of the exchange rate as carry traders get squeezed out of their positions. I expect it will slow and steady, so that Japanese banks get repaid on their loans before most of the capital . Meanwhile hedge fund investors will be the ones left holding the bag.

Labels:

Friday, April 27, 2007

Vacancies as a Function of the Rebalancing Process

The favorite vehicle for foreign investment into the United States over the past two years has been mortgage backed secuirities. Fannie Mae and Freddie Mac offer a guarnatee that their secuirities will make their payments, which creates an impression of safety for a huge portion of the MBS market. Money pouring into MBSs has fueled extreme levels of housing construction, to the point that American builders have been adding far too many homes to the market. This shows up in the vacancy data released today:

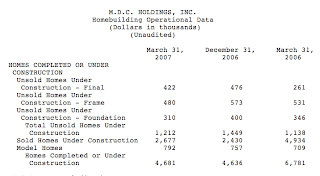
Vacancies for rent rose steadily from 2000 through 2003 in bad economic times, while the sharp uptick in vacancies for sale has likely been a more recent function of the end of the speculative bubble and the mortgage squeeze. Vacancies are likely to continue rising both because the market and economy are continuing to weaken and because homebuilders haven't reduced construction enough. Today MDC Holdings released their numbers and they show an increase in homes under construction without buyers (year over year):

This is true for virtually all the builders, as they have too much land on their books and too many communities still opening up. They ignored the building inventory problems and in 2005 got extremely aggressive with their expansion plans just as the market hit its peak. MDC is still opening up new communities in the worst markets:


As the rebalancing process proceeds, Americans will continue to lose purchasing power. That should be incorporated into the homes they live in. Just as people will have to downside their consumption of imported goods, they'll have to downsize their homes. Single family detatched housing was the biggest product of the housing bubble. The vacancy rate for 1 unit homes is up to 2.5% from 1.5% just 2 years ago. Stress will continue to build in this area as builders like MDC add to inventory at a time when fewer Americans can afford to live in McMansions.

Labels:

Wednesday, April 25, 2007

Hedge Fund Borrowing Propping Up the Dollar and Stock Market

Yesterday I read an article listing the 10 highest paid hedge fund managers in 2006. Topping the list for the second year in a row was James Simons (go bears!), so naturally I wanted to find out what I could about how his hedge funds make their profits.

According to the article, "the hedge fund firm employs roughly 80 PhD's who develop computer programs to seek out price anomalies in a wide range of markets, including equities, commodities, futures and options." I don't have any insights into what Renaissance is doing in the commodities futures and options markets, but at least in terms of equity holdings, the record is pretty clear. The fund began buying aggressively in Q3 2005 and got more aggressive each quarter, almost tripling their equity holdings during 2006:


Before fees, Renaissance's Medalion fund earned a return of 79% (44% after fees). With the stock market up just 15% last year and Renaissance's holdings spread out among almost 3,000 different equities, it's safe to assume that a large amount of leverage was employed to boost the return numbers. Most likely the Fund borrowed Yen during 2005 and 2006 and used these funds to buy dollars and then US equities and other investments. With the Yen down against the dollar over the past two years, highly leveraged borrowings would have greatly increaed the overall returns. Of course a falling dollar and/or a falling stock market would have led to magnified losses, rather than magnified gains.

The biggest spike in buying came during Q4 last year, and the holdings numbers are still fresh, showing which positions were added to and which were reduced. One thing that jumped out at me was that the 4 stocks where the most new capital was directed were all Dow Industrials:

The three stocks getting the most new capital on average accounted for more than triple what other top investments received. Dow Stocks also made up 3 of the top five on the sell side. In all, a net of $2.5 billion was poured into Dow Industrials by Renaissance during the last quarter of the year. This likely helped boost the Dow, as the total index was up 6.71% during the quarter, while the 10 Dow stocks purchased by Renaissance rose a weighted average of 8.11% and the 6 stocks sold only rose a weighted 6.33%. Interestingly, the Dow stocks with shares bought by Renaissance in Q4 were poor performers in Q1 2007 (falling 1.85%) when compared to the good performance of their recent sells (+1.30%), implying that they really weren''t good stock pickers.

When the 80 PhDs go looking for "inefficiencies" I don't get the impression they are doing much analysis of value in a traditional sense. It is noted that Simons hires mathematicians, rather than MBAs, so the soundness of a companies business model and it's future projected earnings are not likely to be a big factor in the computer driven trading strategies. In looking at the stocks where they took on a position of over 5%, there were plenty of stocks with negative earnings per share and high price to book values:


While I believe the 80 PhDs are extremely good at creating successful computer models and trading strategies, I don't need a PhD or a sopisticated computer to figure out what are likely to be the main underlying secrets to their success. The biggest and most lucrative inefficiences to exploit are technical in nature (rather than fundamental). The computer models are probably especially good at detecting when too many people have shorted a stock or when to arbitrage profits out the greedy short term bets options traders like to make. Prices can be manipulated for short term gains or they can simply be driven up almost endlessly for positions the company already holds. The following table shows the date when Renaissance reported going over the 5% ownership threshold for stocks (prior to the start of Q4), and then includes the number of shares added during Q4, presumably boosting the net asset values of the fund:


The next table shows the increasing number of new positions that went past 5% during Q4:


Buying up a large enough number of shares in a stock can drive up the price. We can be sure the programs have concluded that thiswill improve their performance, but given the complexity of the programs involved we can't be sure if the people behind the programs really understand the difficulty of reversing course when the fundamentals of a company or the market deteriorate. The chart of Renaissance's total equity investment over time has the look of a system out of control. It is probably indicative of the our whole financial system, dependent on ever higher rates of borrowing and credit expansion until the day when finally credit from abroad is cut off. Perhaps Simons is already well aware of this and sees no choice but to head forward at full steam.

I don't think "inefficiencies in the markets" is as good a description as "flaws in the system" when it comes to describing the success of computer trading models in generating high returns for hedge fund managers. In my opinion, the stocks Simon's holding are valued less efficiently as a result of his actions rather than more efficiently. Also, in my view, the market as a whole is driven higher through the leverage he and other hedge funds employ, while long term economic instability they are creating should be pointing toward lower valuations.

In an abstract, disconnected kind of way, the computer models probably account for the basic conflict of interests in the hedge fund compensation model: Heads we both win, tails you lose. If the models seek to maximize gain for the hedge fund managers, then they will seek to elevate risk to a very high threshold. While the fund has a track record of earning 36% per year for almost 2 decades, one year of 100% losses would of course negate that for anyone who let their profits ride or came late to the party. I could concoct a scheme to guarantee 50% returns on aveage. Three years of 100% gains, followed by one 100% loss equates to an average return of 50%, but a net loss of -100% for the investor. Meanwhile, I as manager would be syphoning out my 20+% per year before blowing all the rest of the investors money in the final year. If I programmed a computer to simply maximize my projected gains as the manager, an extremely high risk strategy would be the result.

Renaissance is taking on a very high degree of risk. With over $47 billion leveraged into the stock market, they won't have a fun time trying to get out once the market finanally turns ugly. How deeply the bias toward risk is represented in the core mathematical models is a question for the PhDs. Simons has reportedly collected around $3.2 billion in compensation during the last 2 years alone. When most people see those kind of numbers the reaction is that nobody could possibly deserve to make that much money. In my view, Simons has created a brilliant business model that takes advantage of flaws in the system. To the extent that he is profiting from the mistakes of other traders there is no real harm done to the economy. Indeed Simons has done a lot of good through his charitable contributions. However, to the extent that Renaissance is creating systemic risk by (possibly) playing the Yen Carry Trade, creating excess liquidity and promoting malinvestment Simons may be doing substantial economic damage to this country and the world.

The thing I'll be most intersted in watching is wether Renaissance has the ability or desire to reduce its risk exposure before it is too late of if they'll just continue taking on more risk until the system reaches its final limits. Hopefully I'll find some more clues to this in the Q1 holdings report they'll release in May.

Labels:

Thursday, April 19, 2007

Trends in the Jobless Claims Point Toward a Slowing Economy and More Foreclosures

The housing slowdown has gone through two distinct stages so far. The first was related to the rapid exit of flippers who had been putting down deposits on pre-construction homes and then selling them for a profit before the homes were finished. Speculators created a demand vaccuum when it realized they needed to get out of contracts and inventory early last year. The second stage has been related to the tightening of credit and a shift in market psychology cutting into the number of willing and eligible buyers. Usually speculators and easy credit policies complete their cycles without too much of a an impact on the market, but this time they've been big enough to make for a very noticeable slowdown.

The third stage will likely be due to the more traditional cause of housing slowdowns - job losses and a slowing economy. During the last recession, initial jobless claims climbed up over 400,000 per week, but have hovered around 300,000 much of the time since then. People losing jobs is traditionally the biggest cause of mortgage defaults (rather than reseting ARMs). Looking at the seasonally adjusted Initial Claims data demonstrates a rising trend:


The big spike last May was due to the brief shutdown of the Puerto Rican Government. Other than that, the rising trend seems clear and fits well with the well established slowdown in residential construction.

Looking at unadjusted numbers year-over-year (over-year), the recent rise over 2006 levels is clear, although the numbers are now roughly where they were in 2005:

Unemployment levels are still low historically and there isn't likely to be a big uptick in mortgage defaults based solely on the new claims we're seeing right now. The seasonal December and January layoffs may be adding to the rise in recent delinquencies we've been seeing, but it won't be until July when we get another seasonal spike. In September and October of 2005 we saw spikes from the big Gulf hurricanes.

In Year-Over-Year percentage terms, the uptrend is especially clear:

The rate of change in 2006 was mostly negative, even without the hurricane comparisons. The rate of change began to swing sharply positive in February 2007.

Job losses may be contributing to the rise in foreclosures, although resetting ARMS, stagnating price and tightening credit standards are almost certainly the largest causes for now. It'll be interesting to watch the foreclosure numbers when job losses do pick up. Here are a couple of charts from RealtyTrac's monthly foreclosure press releases:


Realtytrac is not exactly a reputable source when it comes to producing economic reports, and it is clear their data is far from perfect. Nevertheless it generally conforms with what other data sources are saying: The economy is on shaky ground and millions of middle-class Americans are feeling the squeeze.

Tuesday, April 17, 2007

Shoppertraking the Retail Slowdown

Russ Winter has been reporting a wide range of indicators showing a slowdown in retail sales over on his blog. He's been watching the mainstream retail sales numbers as well as tax receipts and other obscure indicators.

It's a little hard to see through the the seasonal variations due to the earlier Easter this year. Nevertheless using a six-week moving average smoothes out Shoppertrak's data pretty well:

I've maintained for a good while that government and banking interests are geared toward prolonging the status quo, so it's the final exhaustion of the US consumer that will have to bring the global economy back into balance. For now, consumers don't seem to be willingly giving up their buying habits, so poverty is the face of the exausted US consumer: NY Times article on US poverty levels

Monday, April 16, 2007

Contradictions Between the Treasury and the Fed Data

According to the Fed's H41 statements, Marketable securities held in custody for foreign official and international accounts went from $1.176156 Trillion on 1/31/2007 to 1.205004 Trillion on 2/28/2007, showing an increase of about $29 Billion for the month of February. Meanwhile, the Major Foreign Holders portion of the TIC data released by the Treasury Department today shows Foreign Official accounts only increasing by about $3 billion to $1.451.3 trillion. Estimating January's custodial additions as $17 billion contrasts against the Treasury's reported official subtraction of $3.6 billion.

First I have to say I think that the treasury data is the less reliable of the two and subject to large revisions like the one that usually occurs in June. Also, since the Treasury data has been higher than the Fed data going back as far as this source of historical Treasury MFH data goes.

If we assume that both data sets are reasonably accurate then one of these appears to be a likely explanation:
1. Official foreign accounts at the Fed were big net buyers while official accounts not at the Fed were big net sellers.
2. Non-official international accounts at the Fed were especially big buyers.
3. Both of the above.

Who is buying remains the big question, and I can only find clues, not answers. Total foreign holdings rose $24.3 billion, so non-official investors were likely buying. As a whole, Japan's estimated holdings dropped by $10 billion in February, calling into question my thought that it could be the Bank of Japan intervening as the did in 2003-2004. The total decline was probably down closer to $12 billion because Japan's June series revision was down $21.5 billion. Year over year Japan is down $38.6 billion. China, meanwhile was up $16.3 billion in Feb, had a +$44.3 billion revision in June and is up $97.8 billion year over year. Chinese and Japanese official accounts could be the culprit, if China was buying through the Fed and Japan was selling outside the Fed. However, evidence below suggests that China may not be buying primarily through the Fed.

I've seen the conspiracy theory floated around that the Fed is using secret offshore accounts to buy up US treasuries. IF these accounts actually exist and are included in the non-official international accounts data then they could also explain the big disconnect between TIC and H41 numbers. However, that conspiracy theory has been around for more than a year and prior to the last two months Treasury data was rising faster than Fed data.

The June series revision is the result of a survey sent to institutional bond holders to find out what countries they were really holding securities for. The UK always sees a huge downward revision because it is a major financial center holding bonds for investors from all over the world. Last June UK holdings dipped by $155.6 billion on the revision. Japan also dipped substantially (by $21.5 billion). The biggest gainers were Foreign Official, China and (by default) the United States. Foreign Official and the US both rose by around $120 billion, while China added $24.3 billion. China probably made up a significant chunk of the Foreign Official additions. US institutional investors, and especially hedge funds, probably made up most of the share of treasuries that were being held abroad for US investors.

Still more questions than answers. All comments and theories are welcome.

Saturday, April 14, 2007

Banking System on the Verge of a Major Crisis

A couple of posts ago, I described how the delinquencies were creating a liquidity crisis for mortgage lenders. Many of them have had to declare bankruptcy because they haven't had enough financing to make up for the lack of cash flow they are facing due to rising delinquencies and defaults.

The overall leverage of modern US banks and their exposure to real estate loans has become extreme just at the point when loan defaults are getting out of hand:

The lessons learned from the bank runs that led to the Great Depression have long ago been forgotten by regulators. Banks need to have reserves on hand in order to remain solvent in difficult economic times. Unfortunately holding cash reserves cuts into profit margins, so banks have lobbied the Fed to reduce reserve requirements and allow much greater leverage. Now that banks are developing a strong need for cash many are realizing that they don't have enough of it available:

Both of the above charts display historical data from the Fed's H8 reports. Looking at more recent H8 data gives an indication of how the current banking crisis is unfolding. Over the past year, Banks were very aggressive in expanding real estate lending, commercial lending, corporate bond purchases and lending to securities speculators. Meanwhile, they were extremely lax in setting aside reserves in cash, US treasuries and Agency debt. Here are the year over year increases from March 2006 to March 2007 for the main categories of banking assets:

Real Estate Loans and Leases: +10.56% to $3,316 Billion
Treasuries and Agency Debt: +1.96% to $1,186 B
Other Securities: +12.72% to $1,051 B
Commerical Loans: +12.78% to $1.074 B
Interbank Loans: +21.30% to $365 B
Security Loans: +15.99% to $313 B
Cash Assets: -6.27% to $294 B
Other Loans and Leases: -1.59% to $525 B
Total Bank Credit: +8.40% to $8,366 Billion

Up until Mid-February, most banks didn't think there was a whole lot to worry about because they were able to sell off as much real estate exposure as they liked to investors through mortgage backed securitizations. That source of liquidity came to a grinding halt a couple months ago, and since then there have been some eye-catching developments on banking balance sheets. Real Estate Loans and Leases suddenly reversed course, recording the largest single month decline on record (-1.83%). Cash assets also declined suddenly (-3.32%). In the past, February and March have been big months for banks to acquire US Treasury and Agency debt, as the Treasury faces its tightest season before Tax day in April. Here's the February+March net buying totals for the last 5 years:

2003 $36.2 Billion in Treasuries and Agency Debt to $1075.7 B.
2004 $95.8 Billion to $1200.2 B
2005 $33.3 Billion to $1217.4 B
2006 $34.3 Billion to $1185.9 B
2007 $11.1 Billion to $1209.1 B

The lack of buying by US banks is probably another reason why Foreign Official Accounts had to step up in a big way during Q1 (adding over $140 Billion in securities during the 13 weeks ending last Wednesday).

In recent years banks have been net sellers of treasuries and agency debt from March to January. This time they'll probably be especially large sellers as the need for cash increases. Foreign official accounts are probably the buyers of 2nd-to-last resort, but many of them have been indicating for awhile that they want to reduce their exposure to US debt. The Fed is the buyer of last resort for treasuries, as they can create as much money as they desire and purchase treasuries with permanent injections (they did two last week). Of course doing this would be highly inflationary at a time when inflation numbers seem to be coming in above the Fed's acceptable range.

How long will foreign officials and investors be willing to buy up US debt at these historically low interest rates?
How sharp will the contraction be in real estate lending?
How many banks will be ruined in the process?
How long will it be before other areas of excessive bank credit begin collapsing under their own weight?
How deep of a recession will this all cause?

Stay tuned. As the data keeps coming in, I'll keep blogging what I see in the numbers.

Labels:

Friday, April 13, 2007

Regional Factors in the Rebalancing Process

February's Trade Gap numbers showed a sixth straight year-over-year decline, strongly suggesting that the trade gap really has begun to rebalance. When you look at specific countries and regions, you can get a better idea of how and why it is happening:

While China continues its upward trend (ignore the seasonal fluctuations), Japan and Canada have been flat and Europe has shown a significant decline.

The biggest factors for the regional differences (in my mind) are related to individual currency strengths. The Euro has been on the rise since late 2005 and it eventually had the cummulative effect of narrowing the trade gap with the US. The Yen and Canadian dollar, meanwhile, have been volatile but essentially flat over the last year (Canada making up most of the North American trade gap). China has been slowly increasing the value of the RMB, but China's infrastructure and technical expertise are improving so fast that their competitive advantage is rising in spite of the currency shift.

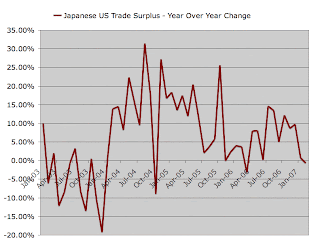
Japan probably isn't happy about their stagnating exports to the US. They faced a similar problem in late 2003 and early 2004 with slowing export growth and a rising Yen. Back then they went balistic with currency interventions, selling Yen to buy US Dollars in order to surpress the value of the Yen. The strategy worked, and the trade surplus with the US began growing again:


That extreme intervention showed up as a big surge in Official Custodial Holdings at the Fed, but that is now being dwarfed by a new buying surge that has taken place in the first part of 2007:

Is Japanese intervention again behind the surge? I think in part it is. The other part is probably a result of the massive Yen carry trade in play. As Yen are borrowed into existence by hedge funds, and sold for dollars, these dollars find their way back to the Bank of Japan and then get spent on US debt securities. My casual observations of the US markets have had the appearance of a strong increase in carry trade activity, with the Yen weakening pretty much every time the US markets rally.

The carry trade has a huge positive long term impact for Japan. The Japanese banking system creates Yen out of thin air and loans them out at around 2% interest. If foreign investors are borrowing about $1 trillion per year, that's $20 Billion in profit for the Japanese economy, assuming that currency rates stay level. Of course the Bank of Japan will be in position to control the exchange rate as they have in the past. When it comes time to end the game, they can let the Yen rise in a controlled fashion to squeeze carry traders out of their positions for an additional 5, 10, 15% profit.

Defaults are a minor concern, so I expect the eventual rise of the Yen will be controlled. This would also protect Japanese manufacturers from a sharp, disruptive rise. Hedge fund managers will normally close down their funds and pay back their creditors before they go totally bust. This enables them to get back in the game because pleasing financiers is more important than pleasing investors. If played right, the Yen Carry Trade is free money for the Japanese economy at the expense of global hedge fund investors.

As for China, it is clear that the rate of change in the RMB simply hasn't been fast enough to reverse the growing trade gap with the US. However, the US consumer appears to be running out of fuel. With the mortgage equity engine stalled, and consumer debt burdens overextended, the US trade gap with China may soon contract under its own weight. China has already begun preparing for the day when most of their exports are to other regions and where domestic demand is increased with a rising standard of living.

Even with manipulation of the currency markets by Japan and China, global trade imbalances appear to be on an unavoidable path toward rebalancing.

Labels:

Thursday, April 12, 2007

Foreclosure Pipeline Update From Novastar

NFI was kind enough to provide their monthly update on the status of their securitizations and the good news is that 30-59 day contractual delinquencies were down on almost all of their issues. The bad news is that's normal for March and that the default levels are still very high. The peak for new delinquencies may have occurred in December, as many subprime borrowers appear to have chosen a lavish holiday season over making their mortgage payments. Those defaults hit the 30+ day threshold in January and 60+ threshold in February. Time will tell whether or not the tightening of credit in March leads to a big enough surge in defaults to top December's levels. The total percentage of borrowers failing to make monthly payments continues to grow steadily as more loan begin defaulting each month.

The following charts show the composition of bad loans for the securitization of December 2005 and the two securitizations of June 2006 as they've grown month by month:


Credit quality in the 12/05 issue was bad enough, and the level of defaults continue to rise. Delinquencies in the June 2006 issues are already twice as high as they were at this stage for the 12/05 issue. One interesting thing to note is that lately NFI has been much quicker to push delinquent loans into and through the foreclosure process in the hopes of raising some cash.

Even more importantly, we should note that Novastar has only just begun to recognize losses on the portfolio. To do so would be to call into question their solvency at a time when they are worried about creditors cutting off funding. Meanwhile the number of homes in the foreclosure process and the number of homes on the books waiting to be sold is ballooning out of control. As long as Novastar avoids selling those homes at a loss they can pretend there has been no hit to earnings. However, the lack of mortgage payments flowing in must be made up for by NFI when they make interest payments to the investors who bought the securities.

Right now, Novastar is facing a liquidity crisis similar to the one that forced New Century into Bankruptcy. Consequently, Novastar is desperately "exploring strategic alternatives" to declaring bankruptcy themselves. It's hard to imagine that anyone will be foolish enough to bail Novastar out of their terrible position.

Let's be perfectly clear here:
1. Cash is tight for the lenders because many borrowers aren't making their payments.
2. It's going to get tighter as the percentage of defaults continues to rise.
3. This is just the first stage, a liquidity crisis that is wiping out many lenders as their creditors scramble to protect themselves.
4. The next stage will cut to the core of the ponzi nature of our financial system.
5. Homes sitting on the books and in the foreclosure process are increasing much faster than they are being sold.
6. The big losses haven't even begun to be recognized yet by mortgage lenders, mortgage insurers and the GSEs.
7. The losses will be massive and spread out over a long period of time as home prices enter a long, steady decline.
8. The liquidity crisis faced right now by the subprime lenders will spread to almost anyone who's solvency is in question.
9. Huge amounts of imaginary wealth will be wiped out in the financial sector and in the greater economy.

During their conference call today Mortgage Insurer MGIC Investment Corp. was pressed on Novastar's condition, and did their best to dodge the issue. MGIC is Novastar's main insurance writer and they maintained that Novastar has been a good customer. That may change soon when Novastar has to start pushing through more loss claims. For now, MGIC is in complete denial, thinking that the market overreacted to the subprime crisis during the first quarter. In addition to primary mortgage insurance, MTG also has large invesments in joint ventures that buy distressed consumer credit receivables (Sherman Financial Services Group) and invest in and service subprime loans (C-BASS). Denial is probably the best way for them to preserve their sanity these days. (The last 10 minutes of the call is the most worth listening to.)

Labels:

Friday, April 06, 2007

Tight Correlation Between Dollar/Yen and Major US Indices

The chart below tells the story:
1. Borrow Yen
2. Buy Dollars
3. Prop up the major US indices.


There wasn't a strong correlation until the subprime market started getting ugly in mid-February. Since then the financial markets have been miraculously saved by an inflow of new money via the yen carry trade. Whenever the Yen has been down or falling the US markets have rallied.

This pattern started with a sharp sell-off in the mortgage bond markets. For a time it appeared that certain yield chaising strategies were blowing up. However, rallies in the Yen likely saved many players for the time being. It has appeared to me that most of the Yen selling has been taking place during US trading hours. My hunch is that the Yen carry trade has become far more leveraged in recent weeks with an even greater systemic risk now in place if it unwinds forcibly.