Economic Rebalancing

The global economy is horribly out of balance, with the United States going deeper into debt each year as a result of a huge trade gap. This blog describes the process of global economic rebalancing. If you have any comments or questions about the posts here, please don't hesitate to use the comments section.

Thursday, September 28, 2006

New Home Sales Distortions

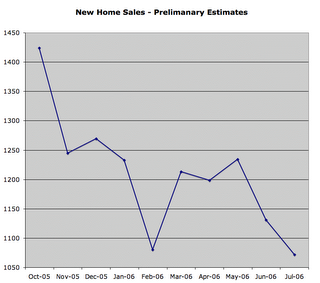
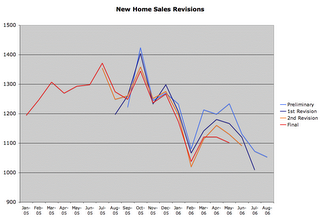
The Census Bureau put out their monthly misinformation report on new home sales. As usual, there were steep downward revisions from past months that made the current totals appear to show a bounce in sales. This chart shows the trends for preliminary, revised, re-revised and final numbers:


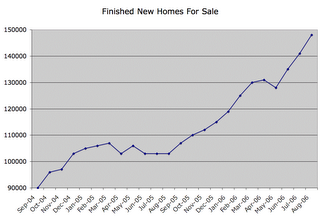
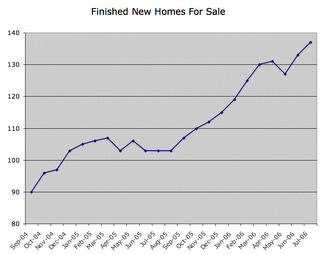
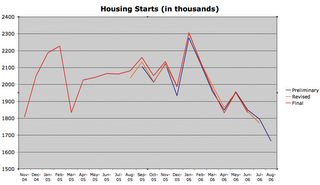
Usually the bad initial estimate can be blamed on data for housing starts. Because builders are starting more homes now that haven't been sold yet, the old methodology for estimating sales yields bad results. However, the starts data was way down in August, so that excuse appears weak:


I think it is safe to assume that the data is being intentionally fudged to hide the nature of the housing market. The data is bad enough as presented, but the true story is probably getting worse all the time:


Builders keep building too many homes because they have too much land and don't want to write off the losses. Until they they let demand catch up with supply, housing will continue to go down. Plain and simple.

Saturday, September 23, 2006

Dollar Under Pressure


Year to date, the dollar is down 1.87% against the RMB, but the rate of decline seems to be accelerating.

Monday, September 18, 2006

Energy Price Fluctuations and Hedge Fund Implosions

Oil and Natural Gas prices are bouncing all over the place and I think a good part of it has to do with games being played in the financial markets.
A couple of large hedge funds have blown up from the natural gas price fluctuations. MotherRock was too short and Amaranth was too long and steep moves wiped them out.

Given the nature of hedge fund manager compensation, the manager has no incentive to play it safe when he's down a lot on the year. He may as well increase the size of his bets hoping to swing back into positive territory so he can score some big fees. If the manager gets hit really hard, then he closes out his positions so that he can pay back his bankers and gives the remaining funds back to investors (often some poor pension plan).

On Wall Street news events and fundamentals are playing less and less of a roll in moving prices as large players leverage up to squeeze whatever paper profits they can out of the market. Since year end bonuses depend on paper profits those are as good as any as far as the traders are concerned.

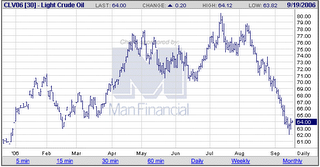
Oil spiked up around the time BP announced they were shutting down a major pipeline in Alaska. Since then US crude inventories have been dropping, but the price has been dropping sharply in spite of that.
I suspect some oil traders have been wiped out along the way, as they are forced to unwind their positions at the bottom. Meanwhile, commercials have been unwinding their short positions at a tidy profit:

It looks like more traders and the hedge fund investors they represent have been taken for a ride.

Long term, energy prices will probably have to rise substantially in dollar terms if Americans are going to reduce their energy consumption and unwind the trade gap. In the meantime anything can happen to energy prices and volatility in these markets seems to be on the rise for now.

Saturday, September 16, 2006

Nouriel Roubini put out a nice, 8-page .pdf disecting a lot of the nonsense out there describing the trade gap. While I think that he produces almost as much nonsense as he debunks, it's still a good read. Here's my critique, where I address all of his main points:

Interpretation one: many blame the global imbalances on the US’s twin budget and current-account deficits.

Roubini rates this as the most plausible explanation, but in my mind it really misses the point. The current-account deficit doesn't cause the problem. It is the problem. Meanwhile, the huge federal budget deficit does promote the trade gap because consumers don't factor in their share of the national debt in estimating their own net worth. Roubini's description of swings in savings and foreign investment patterns is basically irrelevant to the problem of why the trade gap exists, although it does help explain some interesting phenomena like the tech bubble, the housing bubble and the bond conundrum.

Two: Ben Bernanke, Alan Greenspan’s successor as chairman of the US Federal Reserve, claims the imbalances have little to do with the US’s fiscal deficit – because the world is Ricardian, that is, consumers and companies offset an increase in government borrowing by saving more, in anticipation of the future tax rises needed to be pay off the extra debt – and are instead caused by a “global savings glut” triggered by developing countries saving too much.

Roubini is being very polite in saying Bernanke "overstated" his case. I believe Bernanke (and Greenspan before him) have had the politically motivated goal of shifting blame away from the Fed and US Government for the problem. At best the savings glut concept is an idiotic rationalization and denial of responsibility. At worst (and far more likely in my view) it is a blatant attempt to mislead the investing and voting public. It would not be "responsible" for someone in Roubini's influential position to tell the truth about the Fed.

Three: others argue that the imbalances are largely due to a global investment drought rather than a savings glut.

Roubini gives credence to interpretation three, ignoring the obvious other side to the equation: Extreme money supply growth around the world is creating far more investment capital than can be invested at a reasonable rate of return. The problem is especially pronounced in the US, resulting in rapid M3 growth (and thus the discontinuation of the measure) as cash piles up in money market funds. Plentiful investing opportunities would exist if much of the third world was not kept in an impoverished, perpetual state of war and unrest.

Four: in the Bretton Woods II hypothesis advanced by Michael Dooley, David Folkerts-Landau and Peter Garber, China and other emerging markets are causing the imbalances by keeping their currencies artificially low so as to boost their export-led growth.

Roubini says there's some truth in interpretation four, but then makes a logical leap to say that those promoting the view think the imbalances are good. There's a disconnect here, because much of the Economics Underground believes the Bretton Woods II argument while still recognizing that the imbalances are leading toward an economic disaster. In my view, Bretton Woods II has been the biggest cause of the trade gap problem since the early 1980s, because it is the most significant cause of dollar overvaluation. Bretton Woods II only recently has given way to the Yen carry trade in terms of significance in promoting economic imbalance.

Five: the imbalances are caused by China’s excessive saving, owing not to its exchange-rate policy but to the structure of its financial and economic systems.

Roubini gives this some credit, but I don't. Reforms I've seen in the pipeline (like allowing Chinese citizens to invest directly in foreign stocks) would tend to exacerbate the problem, rather than solve it like Roubini asserts.

Six: Richard Cooper argues that the imbalances are caused by demographics and low productivity growth – Japan, Europe and China need to save a lot because they are ageing very fast, while low productivity growth in Japan and Europe exacerbates this need.

Roubini gives this reason a small amount credit for Japanese and European trade imbalances, but discounts it for China. I can agree with him on that.

Seven: housing bubbles in the US and a handful of other countries, caused in part by easy money, are responsible for the imbalances, because they have increased investment (in housing) while leading to a consumption boom, and hence reduced saving.

Roubini calls these a promising partial explanation, but I think he's mixing up cause and effect. The trade gap boosted the housing bubble, rather than the other way around. Foreigners collected dollars because of currency imbalances and then plowed them into US debt of all kinds, which helped promote the housing bubble. He brings up some interesting connections when he mentions the Yen carry trade and decline of various foreign currencies that were boosted by it, but discounts them as a thing of the past. While there may have been a partial unwinding of the Yen carry trade earlier this year, I believe it has come back in force, and the rebound of the New Zealand dollar provides further evidence for this idea. The Yen carry trade deserves to be addressed fully in his discussion, but perhaps it is too important and truthful to be given full treatment if this paper is indeed bent on misdirection.

Eight: financial globalisation is the explanation, because as investors are diversifying their portfolios and investing more of their funds abroad, foreigners’ demand for US assets is greatly increasing.

I'm with Roubini in discounting this theory, but for different reasons. Roubini tries to argue that foreigners are selling US equities. However, according to TIC data, foreigners are not pulling out of equities. Instead they more than doubled net equity purchases to $116.9 Billion in the 12 months ended June 2006. They've been especially keen on buying US corporate bonds, which tend to be more secure than other types of US assets. For me, again, this theory is another example of confusing cause with effect. The strong dollar forces the accumulation of trade gap dollars which eventually get invested back in the US. Meanwhile, savvy US investors are pulling out of US assets and investing abroad before things really get bad in the US.

Nine: Ricardo Hausmann and Federico Sturzenneger argue that the US current-account deficit is a statistical illusion, because “dark matter” – the intangible value of US-owned foreign assets – is not measured correctly.

Roubini is right that this is nonsense, and partially right that US held foreign assets tend to earn more than foreign held US assets. However, he neglects to address the two main reasons for this, which are the long term decline in the value of the dollar and the suppressed yields of US assets due to excessive dollar creation. He also avoids mentioning an important reason why the actual current account deficit is actually much worse than the published numbers, as described by Raymond Baker in his book Capitalism's Achilles Heel Specifically, a great amount of money from international organized crime rings and corrupt third world leaders is extracted from poor people and invested into the US without detection in official figures.

Ten: the oil exporters are to blame, because they are saving rather than spending their huge windfall gains from rising oil prices.

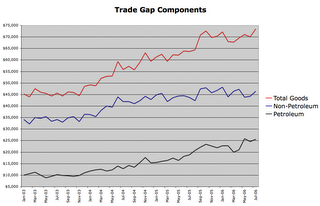
Roubini discounts both the size and importance of the trade gap with oil exporting nations. He doesn't seem to realize that the trade gap for petroleum products has been accelerating and is now over $25 Billion per month. Meanwhile, the US consumer is gasping for breath and the trade gap for non-petroleum goods appears to be in decline. Roubini is right to suggest that the US will need to reduce energy usage, but I think he is wrong to suggest that this can or will be done voluntarily or without significant economic damage. The way things are heading, it will eventually require a steep increase in the price of oil due to a sharp decline in the value of the dollar that would force consumers to cut back due to lack of funds.

To sum up my position:
The dollar had been kept low because of Bretton Woods II currency peggin and intervention by the Bank of Japan. More recently, the Yen carry trade has played a greater role. This is the primary cause of the trade gap.
A secondary cause is the illusion of wealth created by over-stimulation from the massive federal deficit and loose monetary policy. Excessive oil consumption is a large and growing part of this.
A third cause is the feedback of investment dollars coming back as the result of the trade gap, although this is decreasing in significance as intervention by foreign central banks has declined.


What to Do

Roubini insists that the global imbalances can only be unwound if several countries take action. He wants the US to reduce its budget deficit and increase private savings and I agree that both steps would be beneficial. However, the most important step for the US to take would be to cut short term interest rates and intervene in the currency markets to bring down the value of the dollar. That isn't going to happen because Wall St. is in the insurance business and a stable dollar is essential for protecting the profits of big banks like Goldman Sachs and JP Morgan.

Roubini wants China and other nations to relax their pegs to the dollar and for Europe and Japan to accelerate structural reforms. China has been doing their part in strengthening against the dollar in a very responsible and steady fashion, while the Europe has been grudgingly and whiningly been doing theirs as well. Meanwhile Japan is predictably pursuing its own best interest by keeping the Yen weak. This keeps Japan's economy humming and provides cover for the BoJ to reduce its holdings in US treasuries. As they do this, large amounts of US Treasury and now Agency risk is being transfered to the pension plans of American workers.

Roubini also wants oil exporters to relax their pegs, but this is meaningless because labor in these countries does not compete with labor in the US in any meaningful way. (Excluding Venezuela) wealth from oil exports goes into the hands of the wealthy while the masses receive little benefit. Increasing consumption in these nations would require a substantial redistribution of wealth and power rather than a currency revaluation.

The solutions to reducing the trade gap are amazingly simple. Yet, they go directly contrary to the interests of America's ruling elite. That is the reason the gap has persisted in growing to such dangerous levels. That is also the reason why Economists like Roubini aren't able or willing to tell the true story about global economic imbalances. To do so would be to put their own careers at risk. I am grateful, however, for economists like Nouriel Roubini and Steven Roach who at least are willing to bring attention to these issues. Along the way they provide many interesting statistics and facts that improve the analysis of people who are able to read between the lines.
Thursday, September 14, 2006

Here Come the Foreclosures

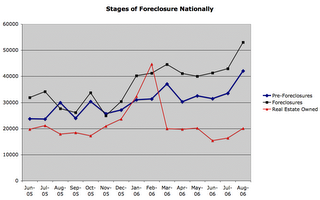
Foreclosures fluctuate seasonally, and they normally trend down through the summer months, which are prime selling months for real estate. This year, however, foreclosures picked up in July and took off in August, when the housing bubble finally burst. I expect foreclosures will accelerate more dramatically from here, as the normal pattern is for increased foreclosures in the Fall and Winter, and the number of distressed borrowers is rising.

The following chart shows one company's tally of homes in various stages of foreclosure nationally:
-Many distressed borrowers now have their homes on the market and will give up on selling their homes as the buying season ends.
-I expect banks will see an especially large surge in defaults in October, November and December, especially in California and Florida where more borrowers are overextended.
-Banks will tend to accumulate more real estate owned during the winter months and try to put it back on the market in Spring, especially in Rust Belt states.

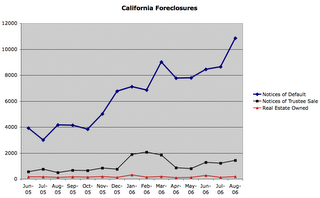
The following chart shows California homes in various stages of foreclosure:

-Affordability issues are killing the market in California and other coastal areas.
-As home price appreciation disappears, cash out refinancing ceases to be an option for most overextended borrowers.
-Notices of Default pick up first, followed quickly by Notices of Trustee Sales.
-Lenders haven't accumulated much real estate because it has been easy to unload homes in foreclosure sales up until now. Some lenders may choose to accumulate real estate and inflate its value on the books, rather than write off losses.

The following chart shows Real Estate Owned by banks in Michigan and Ohio:
-These markets have been relatively soft for a long time, so real estate owned is much higher here than in California.
-Banks have had a cyclal pattern of accumulating real estate in the Winter and selling it off in the Spring.
-These markets are showing the first actual price declines because of forced sales into a saturated market.

Overbuilding led to the rise of surplus inventory. That eventually caused price appreciation to level off. The next big wave has now begun, where distressed borrowers are forced into selling at lower prices. Now we'll start seeing large price declines, as home values decline toward levels that average people can afford. Of course home prices have a long way to fall before they reach those levels, and economic processes take a very long time to unfold. I'm not expecting a bottom in the housing market for at least another 4 years, and probably longer.

Follow-up
Just to share a couple of quick comments I got as a result of posting this item to a board on the Motley Fool...

From a realtor: "Great post, and I agree with one of your key points that this may get much worse in a hurry this winter. The already unfavorable ratio ofsellers/buyers will get much worse."

From a mortgage broker: "Currently banks are simply delaying the proceedings of foreclosure, often times letting the occupants ride free for months and months...

You see... the PUBLISHED REPORTING of the foreclosures could have significant effects on the bank stocks, and the portfolio bond yields... so, we're simply observing the real-world results of yet another slice of unregulated accounting manipulation in the banking industry."

Tuesday, September 12, 2006

New Monthly Record Trade Gap

The trade gap in July set a new record at $68.044 billion.
The prior record had been $66.598 billion, set in October of 2005.

The big culprits were:
Net imports of petroleum products, which were up 35.98% year-over-year to $25.576 billion,
Exports of goods, which fell by $1.3 billion,
Imports of goods, which rose by $2.1 billion.

Looking at the longer-term trends that got us here, imports of petroleum products are really killing us. Imports of other goods still appear to be trending down, but petroleum imports are curving upward:

I don't buy the hype in the mainstream financial media that says the commodity boom is over. While we may be heading for some form of global economic slowdown, I'm inclined to believe that the growth engines of the developing world will continue to create heavy demand of industrial supplies. If nothing else, the huge foreign currency reserves amassed by China will allow them to continue purchasing industrial goods to build out their infrastructure in the face of an eventual export slowdown.

Net exports of services are now down year-over-year to a feeble $5.395 billion as our edge in knowledge and technology continues to decline. The main way we can hope to begin reducing the trade gap is to reduce our net imports of goods. For that to happen, the dollar must fall, but unfortunately the foreign currency markets are refusing to let that happen. After an initial dip, on today's numbers, the Dollar actually rallied back stronger against the Yen. Japanese and American governments and central banks seem unwilling to pull the plug on the Carry trade. It may be up to China to force the issue, after adding another $19.6 billion in trade gap dollars to their monstrous pile in July.

So another month passes, and Americans go another $68 billion deeper in debt. The longer the world puts off a substantial decline in American living standards, the ore severe that decline will eventually be.

Sunday, September 10, 2006

Builders Burning Through Cash While Amassing Inventory

The publicly traded homebuilders were amazingly aggressive in their land acquisition strategies over the past several years, and they are paying for it now in interest expense and write-downs. On their income statements all but 3 of the smallest builders are still showing large profits. However, cash flow statements show that the builders are burning through cash and increasing borrowings at an alarming rate. With sales in the early stages of a long, steep decline, they are putting themselves at the mercy of creditors, which I expect will result in bankruptcy for some of them. I took a good look at the cash flow statements of all the publicly traded homebuilders.

For the group of 15 builders who have reported cash flows for a quarter ending 6/30/06:

1. Their total cash position dropped $908,566,000 during Q2 '06, vs. $132,668,000 during Q2 '05. It's normal for the builders to use cash building homes in Q2 that will be closed on in Q3 and Q4. However, this year builders are spending much more money on spec homes that haven't been sold yet and are seeing many more last minute cancellations that leave them short on cash.

2. Along those same lines, net borrowings increased by $2,942,020,000 during Q2 '06 vs. $1,483,781,000 during Q2 '05. That's an additional $1.5 billion borrowed by perhaps 15% of the nation's total homebuilding industry. Multiply that out, and you have a pretty substantial boost to the money supply. Much of it was just the expansion of credit facilities, but a good portion was also in the form of new long term bonds. While builders are burning through all this cash, they are booking most of it as inventory and thus avoiding a blow to profits, but in the meantime...

3. They increased money spent on share repurchases to $558,006,000 during Q2 '06, vs. $207,069,000 during Q2 '05. Just as they thought increasing land holdings to 6 years supply or more was a good idea in 2005, many of them seem to think that borrowing money to repurchase shares is a good idea right now. While share prices are low now relative to the same time last year, I believe that several builders will see their prices fall all the way to zero before the current shakeout is complete.

Not all builders are responding to the slowdown equally. NVR, MDC and TOA all borrowed less this Q2 than they did last Q2 and their cash positions fared better this year as well. MDC and TOA never spent money on share repurchases and NVR dramatically reduced theirs when the market turned, spending nothing during Q2 '06. By accepting the harsh reality of the bursting housing bubble early, they greatly increase their chance of surviving it.

On the worst end you have WCI, with a rapid deterioration of their cash position (93% lower than a year ago), a 461% increase in Q2 borrowings (to $217.8 million) and $43,580,000 spent on share repurchases last quarter. They face huge problems with about half of their revenues historically coming from Florida condo sales and the story is being told in their cash flow statements. Perhaps they are repurchasing shares because they are dumb enough to think their stock is a bargain right now. Perhaps they just want to prop up the share price long enough for insiders to cash out before the collapse.

The biggest builders were of course the biggest borrowers, with DHI, PHM & CTX borrowing $687.4, $716.1 & $840.5 million respectively during the quarter. How long their creditors will continue to finance their building of more homes than people want to buy remains an important question. DHOM already seems to be hitting a financing wall. If they can't get enough money to pay the bills from customers or the banks, then bankruptcy will soon follow.

All of the data above covers the June quarters, while cancellation numbers didn't really turn ugly until July and August. TOL and HOV report quarters ending July 31st, but they are more conservative than most. TOL followed the trends of the June builders, but the damage wasn't too extreme. HOV should file its 10-Q next week. KBH and LEN report quarters ending August 31st, and it should be especially interesting to see the fincing portion of their cash flow statements as they are two of the more aggressive builders.

Friday, September 08, 2006

Some Counter-Arguments

Mark Lapolla blogs some interesting market observations and views, but I think he's trying to rationalize his directional leaning too much in this recent entry.

In response to his quotes, I offer the following opinions:

"The Global Economy is slowing. I believe everywhere--including China."

Many consumers are hitting a wall in the US, but that's because of debt burdens and cost increases. Globally, economies continue to grow, and will continue to grow if the rebalancing process goes smoothly.

"Central Banks are at the end of a MASSIVE, coordinated tightening."

They raised interest rates, but they didn't tighten credit. Money supply continues to expand rapidly. Much of it due to hedge speculation and the Yen carry trade.

"Global inflationary pressures are benign. Labor does NOT have pricing power in the developed world. Period."

That all depends on what you are measuring for inflation and how. Hedonic adjustments help keep CPI low, but monetary expansion keeps building pressure on resource costs while driving down investment returns. Governments and monetary authorities can't resist the inflation temptation for long.

"The World is awash in capacity--China will lead a new round of Global dis-inflation within the next year or two."

The China I've been watching has begun raising prices, and will likely continue to raise prices with foreign currency reserves already approaching $1 trillion.

"Oil is going lower. Period. Intermediate goods pricing will not translate into sustainable end user price increases. Commodity prices will peak and go lower--soon."

Oil has already come down about 15% which is probably enough for producers to ease off of production a little and for China to consider filling up their reserves a little. I expect other commodities will have technical corrections like Oil, but capacity is not rising fast enough to keep up with growing demand.

"The US Housing Bubble is NOT a Bubble. Some US housing markets ARE Bubbles: South Florida condos to name one."

It most definitely IS a national bubble. Easy credit was available everywhere, and hordes of amatuer investors from California leveraged themselves up to buy into markets with lower prices. If prices didn't go up in a region, it was because the economy stunk there and people didn't want to live there. Those factors are getting worse, and rust belt markets are actually leading the nation in price declines as the bubble bursts. As debt burdens become overwhelming, the deleveraging process will hurt prices everywhere.

The media finally caught on to some of the oversupply issues, but they don't understand why builders are choosing to continue building too many houses, and they don't understand the effect foreclosures will have on the market in 2007 and beyond.

Wednesday, September 06, 2006

While the dollar has fluctuated widely against the Yen, Euro and Canadian Dollar, the Bank of China has engineered a slow steady decline of the dollar against the RMB.

A couple of years ago, I expected the RMB to repeg pegged to a basket of currencies because that would allow the RMB to stay relatively weak in a global sense, while disconnecting itself from a deteriorating dollar. That was the policy announced last July, but it really hasn't been in effect over the past 14 months. Repegging to a basket may still be the eventual goal, but China appears to have an intermediate stage in mind right now, where the RMB gradually strengthens against the dollar regardless of what the dollar does relative to other countries.

The above chart demonstrates a few interesting points:
1. While the dollar was falling against almost everything in April and May, the RMB actually remained pretty flat relative to the dollar. One would expect the RMB to appreciate more when the dollar was declining against everything else.
2. The Yen has been weakening relative to almost everything since mid-May, presumably because of increased use of the Yen Carry Trade. The Yen declined especially abruptly in August.
3. China and Canada run the greatest trade surpluses with the US and their countries have been strengthening the most relative to the dollar over the past month. (Japan runs a close 3rd to Canada.)

By the end of July, China had accumulated $954.5 billion in foreign reserves, exceeding 2nd place Japan ($864 billion in June), 3rd place Taiwan ($260 billion in July) and 4th place Russia ($259 billion in August). The net wealth of the average Chinese citizen is increasing rapidly (both because of the growth of the foreign reserve pile and because of the rapid infrastructure build that is taking place within the nation) even if most Chinese aren't aware of the long term implications of the country's gains.

Chinese officials talk as though the pile of cash is getting large enough to pose a systemic problem and propose minor changes to try and slow the flow. But in truth I suspect the Chinese government wants to continue amassing wealth as long as foreign governments are willing to let them.

The rate of decline in the dollar/RMB has picked up recently and I suspect the dollar will continue to fall against the RMB because imbalances are so great. Against the Yen, however, the dollar has been very strong of late. Something should eventually give, and as the Yen's weakness is based on trading activities rather than fundamentals I expect a strengthening Yen is the most likely outcome.

Monday, September 04, 2006

Construction Spending

Construction spending is only about 8% of GDP, and provides only about 6% of non-farm employment. However, it is probably the most vulnerable portion of the economy to recession, and private construction is even more vulnerable than public construction. Many observers are calling for a recession led by housing. I tend to think that excessive debt is causing the economy to stall and a slowdown in housing will increase the severity of the problem. (Because the debt problem is permanent, rather than a function of the credit cycle, I see and economic slowdown as part of the rebalancing process that moves us toward a more sustatinable level of consumption rather than a cyclical recession... now back to the topic of construction spending)

Non-Residential Construction was booming during the late nineties and 2000, as tech companies took their IPO and SPO dollars and built big corporate headquarters. That went into a long, steep slowdown when the bubble burst and the easy money dried up.

Residential Construction has had two brief periods of decline, related to rate hikes and economic slowdowns in 1995 and 2000. It took especially long for housing to roll over this time because rate hikes were met with new waves of lowered lending standards. Excess residential construction the past 3 years will likely give way to several years of slower construction as surplus housing inventory is absorbed.

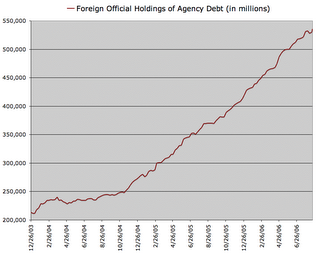
The housing bubble appeared to be deflating on its own at the end of 2004, but then foreign investors started snapping up Agency debt, which helped fund a new round of easy lending and home buying. With housing prices on the decline in most areas, Agency debt has become a poor risk and foreign investors may start to shed holdings the way they've been reducing treasury holdings of late.

Sunday, September 03, 2006

Post Labor Day Breakdown?

I've observed over the years that holidays often mark major turning points in the market. According to my theory, families and friends get together over the holidays and talk often turns to how great their portfolios have been doing (or how poorly they've been doing). Coming out of the holiday, the greatest fools try to jump on the bandwagon just as the market reverses course.

The current situation bears some remarkable similarities to the market situation in 2000. Six years ago, the tech bubble had already burst, but the broader market still struggled through the summer and appeared to be rallying into Labor Day. After falling from an all time intraday high of 1552.87 on March 23rd, the S&P 500 rose from a low close of 1419.89 on July 28th to a high of 1520.77 on Friday September 1st. Buy-the-Dippers were celebrating their success at family barbeques. By Christmas, the market was down to 1305.95.

This year is similar in that the housing bubble has clearly burst. The S&P500 peaked around 1326 in May. Then they took a dive to 1234.28 on July 17th but have since bounced back up to 1311.01 on Friday September 1st. This year's group of buy-the-dippers are probably congratulating themselves this weekend.

With the S&P500 and Dow30 doing much better than smaller stocks over the last three and a half months, and the big permanent and temporary injections of last week, it smells like a possible top. Of course these rallies usually go on longer than I expect them too.

Even with the major market indices rallying during the month of August, the short portion of my portfolio had its best month of the year. Retail, Builders and Sub-Prime have been taking an early dive as they should be given the macro-economic climate. Consider this updated chart:

That account, based on the principals of the rebalancing trade, is up 62.8% since the end of April, after being down 26.7% over the first 4 months of the year. The short positions in that account are typically the individual companies I think are most vulnerable to an economic slowdown in the sectors that I think will be hardest hit by the rebalancing process.

(So here it is, Labor Day Weekend, and I'm talking about how great the short half of my portfolio is doing, and expecting it to do even better if the broader market starts to slide. It'll serve me right if the market rallies and takes the garbage stocks with it.)


In my view, fuel for the market prop job has probably been coming from hedge funds borrowing yen, buying dollars, then sinking them into treasuries and large cap stocks. While the RMB continues to strengthen against the dollar, the Yen has remained weak. This chart shows a fairly strong correlation between the Dollar vs. the Yen and the performance of stocks and five year bonds:

Carry traders picked up the slack when the Bank of Japan began reducing their treasury holdings. The BoJ is probably willing to let carry traders continue to pile on the risk for now before they start a long, slow squeezing process that bleeds all the profit and money out of the hedgies. Japan wouldn't want a rapid unwinding because that would cause a shock to their own money supply.

All this leaves me torn between expecting a change of direction over the labor day weekend, leading to a broader market decline, and a continuing prop job to get Wall Street through one last Christmas bonus cycle before things break down in January. The fact that Mauldin also noticed the similarities with 2000 and broadcast his thoughts to a wide audience, tends to make me lean toward a continued prop job through the end of the year. Time will tell.

Saturday, September 02, 2006

Mainstream Economist Lies

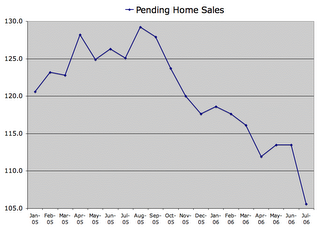
Pending home sales took a steep dive in August, as the housing bubble continued to deflate. It still has a very long way to go, but you wouldn't get that impression from listening to high-ranking housing economists. To them the bubble was a permanently high plateau when we were at the peak and any decline is part of a soft landing.

Pending home sales are one of the most current indicators of the housing market, and they took a steep dive in July:

David Lereah is the chief economist of the National Association of Realtors. His job is to spin the data to the best of his ability so that people want to rush out and buy homes, making money for the membership of his organization. Here's what he's been saying ever since the Pending Sales peaked and turned downward.

September 1st, 2005: “The Pending Home Sales Index is at the fifth highest reading on record, meaning we can expect historically high home sales to continue in the months ahead,” he said. “The index has been fluctuating in a fairly narrow range over the last six months – a very high range – so the overall market is moving forward with a lot of momentum.”

October 5th: “...national sales should stay close to record levels over the next two months and housing will continue to support the economy.”

November 3rd: “We’re still seeing a post-Katrina boost in home sales activity, where the needs of displaced residents are supplementing a fundamentally strong market,”

December 6th: “The drop in pending home sales is an affirmation that we are experiencing a modest slowing in the housing sector,” he said. “The index is pointing to a soft landing for home sales, which will help to correct the inventory shortages that have dominated housing over the last five years. This should restore balance to the market.”

January 5th, 2006: “In other words, home sales have been peaking for the last five years and we will land on a high plateau in 2006 – a market that will be healthy for both buyers and sellers. Investment fundamentals for housing remain solid, preserving generally favorable affordability conditions while offering solid returns as well as a place to live.”

February 1st: “In many recent transactions we’re looking at a delayed effect of mortgage interest rates that peaked in November but are now lower than expected. Mortgage applications have trended up in recent weeks, so we shouldn’t be surprised to see pending home sales rise in the next couple months.”

March 6th: “This looks like we’re touching down for the soft landing we’ve been expecting,”

April 3rd: “We can expect a historically strong housing market moving forward, earmarked by generally balanced conditions across the country and fairly stable levels of home sales with some month-to-month fluctuations,”

May 2nd: “Home sales rebounded from the slide that started last fall, but the pending sales data is showing a dampening effect from rising mortgage interest rates that have been trending up since January,” he said. “This means a modest slowing can be expected in the sales pace in the months ahead, although the market will hold at historically strong levels.”

June 1st: "I see this time of adjustment as being a trough in home sales that will more or less level out toward the end of the year. Over time, homeownership remains the best investment a family can make.”

July 6th: "“The slight change in pending home sales indicates the market is beginning to level out,” Lereah said. “This is consistent with our forecast, which is showing a soft landing for the housing sector. We are entering the second phase of the transition period from the housing boom, in which sellers are becoming more realistic about their expectations – sales are stabilizing and annual home price appreciation is returning to historic norms.”

August 1st: “The housing market is striving for balance – a process that will take several months. A quieting in the movement of indicators should restore confidence to home buyers who’ve been on the sidelines, waiting for the right time to get into the market, and now is the best time we’ve seen since the 1990s in terms of housing choices and flexible terms.”

September 1st: “Psychological factors are causing some buyers to remain on the sidelines, waiting for prices to stabilize or for more favorable news about the market and the economy. Contributing to this hesitancy is a lot of negative news stories, but in the end we believe that underlying market fundamentals will prevail.”

OK, Dave, here's the fundamentals:

Builders have built way too many houses and they are still building too many because they're stuck with too much land.
Borrowers have overextended themselves and the defaults and foreclosures have only just begun to rise.
The economy is begining to roll over and things will get really ugly when the recession begins.

You know this, Dave but you continue to lie through your teeth to promote a narrow, selfish agenda. Hopefully someday someone will take you to task.