Economic Rebalancing

The global economy is horribly out of balance, with the United States going deeper into debt each year as a result of a huge trade gap. This blog describes the process of global economic rebalancing. If you have any comments or questions about the posts here, please don't hesitate to use the comments section.

Tuesday, October 31, 2006

Chinese Foreign Exchange Reserves

Chinese reserves reached $988 billion by the end of September and are now most likely over $1 trillion. China's wealth continues to increase, and this is leading to a rise in Chinese consumption.

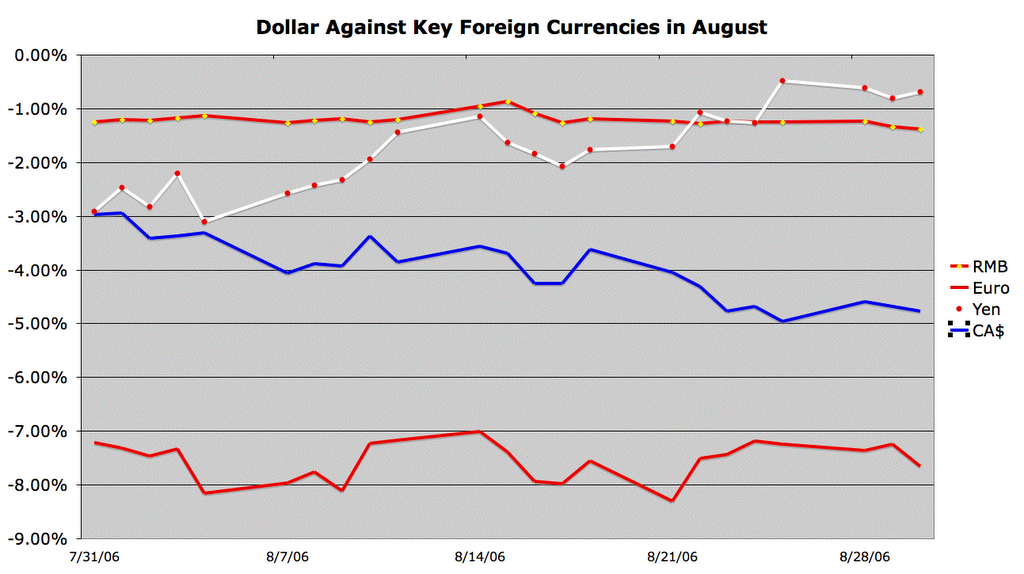
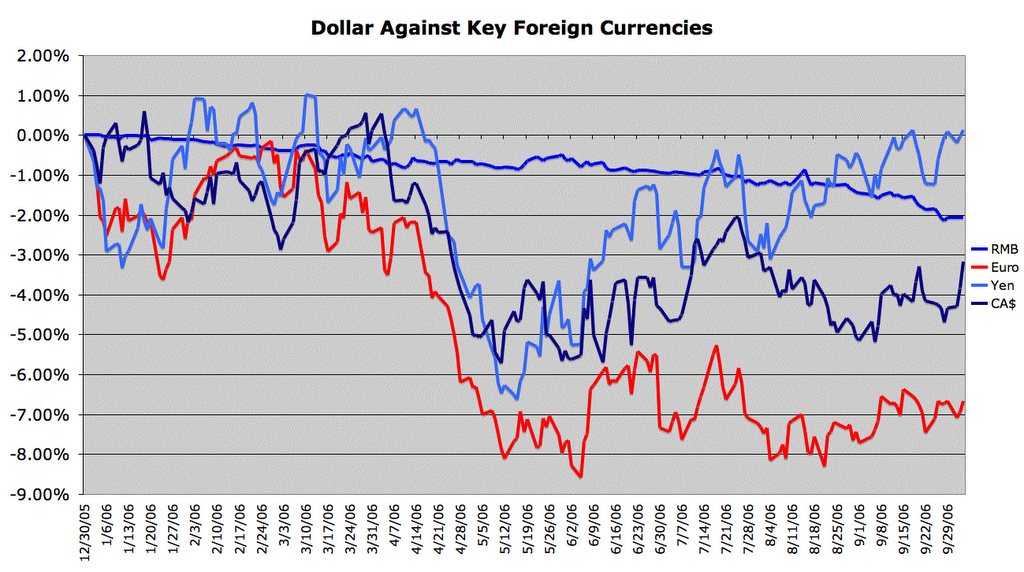
Even more importantly, the skills of its labor force, the quality of its educational institutions, and it's manufacturing base continue to grow in strength, suggesting that China will continue to be a manufacturing power even if it's currency is allowed to appreciate. So the dollar is now falling against the Chinese RMB:

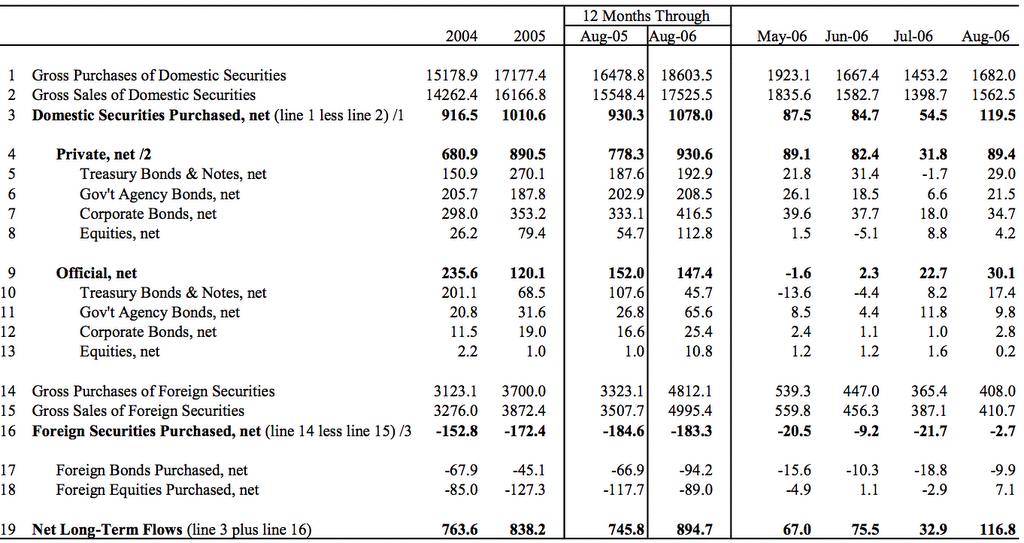
While trade imbalances have been responsible for much of the growth in reserves, there has also been a large amount of foreign investment into the country. The world's largest IPO took place last week, raising around $22 billion for the largest Chinese bank, but that is just part of a long series of Chinese IPOs and foreign ventures into the country.

With so much capital already accumulated in the country, it might seem strange for officials to try and attract more. Indeed, Chinese policy makers have been trying to reduce foreign speculation into the country. However, the banking sector in China has made itself vulnerable by extending too much credit to manufacturers and real estate developers. The real estate bubble in parts of China resembles the real estate bubble in the US. (I'm not sure which bubble is worse, Shanghai or Florida).

The big banks have billions of dollars worth of problem loans on their books. To me it seems as though the recent string of bank IPOs are at least in part a way to shore up the balance sheets of Chinese banks on the backs of foreign investors. If so, then it is an improvement over the methods used by the Japanese and American central banks to protect their banks from their own excesses.

In Japan, after the real estate and stock market bubbles collapsed, Japanese banks were technically insolvent. The banks were allowed to stay open while the country instituted a zero-percent interest rate policy to boost banking profitability and eventually bought up stock positions from the banks to preserve their liquidity. After a long period of time, most of the banks had worked themselves out of the hole. Zero-percent interest rates, however, have led to speculative excess in Japan and throughout the world as a result of the Yen carry trade.

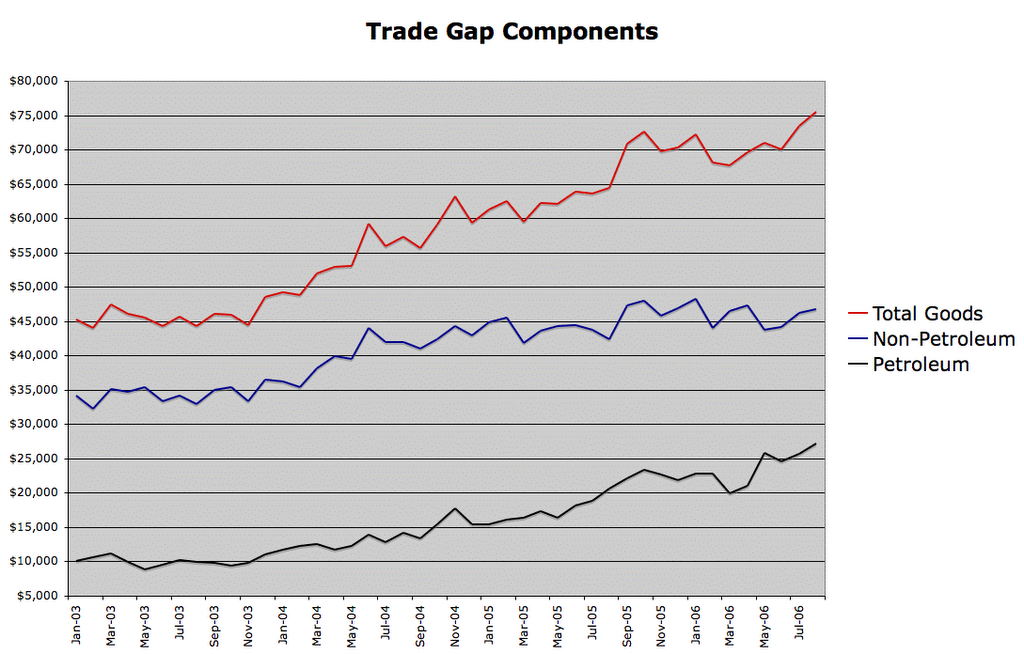
In the US, many banks were in trouble after the stock market bubble burst. The Fed lowered interest rates to boost profitability and stimulate the economy, but this dramatically inflated the housing bubble, fueled credit expansion on many fronts and allowed for a dramatic worsening of the trade gap and national debt. The result has been the creation of a much more precarious economic situation.

When the chickens finally come home to roost, and the global economy rebalances, I expect we'll see that the Chinese economy, monetary and banking systems all come out looking the strongest.

Saturday, October 28, 2006

A Long, Cold Fall and Winter

For most people trying to sell homes this Fall and Winter, it will be a long, cold 5 months. We've entered the slow season, when many sellers simply choose to take their homes off the market. However, with ARM resets and affordibility issues hitting many, the number of distressed sellers continues to rise.

Looking at Existing Home Sales data from the past two years, the seasonal buying pattern is clear:


When we compare the monthly sales totals with the inventory totals, we can get an estimate of the percentage of homes on the market that actually sold during the month:


In September of 2004, around 24.01% of homes on the market sold.
In February of 2005, around 17.25% sold.
In June of 2005, around 28.12% sold.
In September of 2005, around 22.73% sold.
In February of 2006, only around 13.43% sold.
In June of 2006, only around 18.70% sold.
In September of 2006, only around 14.07% sold.
In February of 2007, perhaps less than 10% of homes on the market will sell.

Friday, October 27, 2006

Homebuilders Digging Their Own Graves

Standard Pacific Homes released a surprisingly large amount of information Thursday afternoon that underscores the trap the homebuilding industry has placed itself in.

Among the highlights:

1. Revenues were down from $937 million to $834 million, just an 11% drop, not a big deal in an of itself.

2. EPS was down to $0.47 from $1.37, so they still appear to be profitable. Nothing to worry about, eh? The housing market will turn around in the Spring, right?

3. Net new home orders for the quarter were 1200 vs. 2888 the year before, a 58% drop, so future quarters should be much, much worse for profitability.

4. Average number of selling communities for the quarter was 209 vs. 165 last year. That equates to 5.74 net orders per community this year vs. 17.05 last year, a 66% decline. Standard Pacific, like all publicly traded builders, tried to expand aggressively just as the market ran out of steam.

5. Inventories are up by over $600 million this year, while liabilities are up by over $700 million. It is only an illusion that this company is profitable. They capitalize construction costs and interest expense for now, but will eventually have to take large write-offs or sell homes at a substantial loss.

6. Backlog of ordered homes is down to 4426 from 7762, or 43%. This should lead to a dramatic slowdown in construction going forward. However...

7. Homes under construction totaled 5657, down from 7649, so the company is building over a thousand homes now that haven't been sold.

8. Completed and unsold homes now sits at 623 vs. 247 last year, and the total should continue to rise given the construction vs. backlog numbers above.

9. Building sites owned was 37,609, up from 35,547, although sites optioned was down from 26,630 to 13,196. Like most builders, Standard Pacific has been writing off options contracts, but they aren't willing to cut their losses on owned land.

10. Joint venture activity is especially suspect, as orders at JVs were only 5 per community (55 total), while construction vs. backlog was 718 vs. 255. Like most builders, the company has off-balance sheet arrangements with mysterious outside investors (think Enron). Activity at JVs suggests somebody's interests are being protected, and it most likely isn't Standard Pacific's shareholders.


As I've said many times before in many different forums: The builders are digging their own grave by building too many homes. They are doing this because they bought too much land and they want to put off taking losses as long as possible. Of course this only means that the eventual damage will be much greater.

The housing market is going to get much, much worse, due to both the overbuilding problem and the rising foreclosure problem. We can thank builders like Standard Pacific and lenders like Accredited Home Lenders for this problem.

Friday, October 20, 2006

A Warning of Things to Come

Sub-prime mortgage lender Accredited Home Lenders issued an earnings warning yesterday morning, citing three main reasons for their disappointment:

"-Origination volume and loan submissions have not increased as much as the company anticipated and continue to be adversely affected by a combination of pricing competition and product contraction that has been prevalent in the market throughout 2006.
-Whole loan premiums and securitization returns are under more pressure than previously anticipated, caused a decrease in whole loan investor appetite for certain products, as well as changes in credit standards and equity requirements promulgated by the various rating agencies.
-Delinquency from production periods in 2005 and 2006 has risen above previous expectations, which requires the company to further bolster its reserves to prudently value the loan portfolio and potential exposure.
"

They claim not to have anticipated these developments, but all three were predicted by many commentators.

-Even in good times the Ponzi business model employed by most of the mortgage banking industry required ever increasing loan volumes to keep default rates down. New loans typically don't go bad as fast as bad loans, so the rapid growth rate of the sector helped hide the truth about the quality of their holdings. Now that the sector is having trouble growing, reported default rates are on the rise and profits are evaporating.
-The market for mortgage backed securities grew far too rapidly, and the supply of easy credit had to end. Now there are far fewer suckers out there who want to buy securitized sub-prime loans because the housing market has turned and foreign investors and portfolio managers are recognizing more of the risks.
-Imaginary profits were boosted by low reserve allowances. Their loss estimates were based on default patterns during the housing boom, not during normal times or a housing bust. As they have to increase reserves to cover real losses, their imaginary profits of the past turn to today's losses.

Most lenders are trying their hardest to postpone the bad news to keep their stocks afloat and their credit ratings intact. The situation is surely much worse than they are willing to admit. The mere fact that that more of them have started to give warnings is an indication that things are getting really bad in the industry.

(Additional problems in the lending industry were desribed in an earlier post.)


What is happening in the mortgage industry gives a good indication of what will soon be hitting the entire economy. Just as the mortgage lenders required an exponential increase in lending to preserve an illusion of prosperity, our economy has required exponential credit expansion and borrowings from foreigners to preserve the illusion of economic strength. For the past half century (and especially since the Reagan years), we've cycled through various sources of credit expansion, from government and industry to consumers, and finally to the pure speculation of hedge funds. Our main funding sources, aging baby-boomers and foreign central banks, are reaching a limit in their willingness and ability to extend credit, and the borrowers are reaching a breaking point with regards to debt service.

According to Moody's (and just about every other reporting source out there) defaults and delinquencies are up shaply this year. That's what happens to problem borrowers when they reach the limits of their ability to borrow. As it is happening to many homeowners, it will happen to many companies, many leveraged investors, and eventually the US government.

I cannot believe that Accredited's managment didn't see this coming long ago. When the company eventually fails, leaving shareholders with nothing to show for their investments, the executives will still retain the millions of dollars worth of compensation they've collected over the past few years. Likewise, when the US economy is brought back down to size, the financial industry executives who created great systemic risk and politicians who squandered the nation's wealth will most likely be living comfortably on their profits and pension benefits. Because our system compensates managers based on short term objectives, we get short sighted policies that have eroded our financial strength.

It isn't difficult to understand why Accredited is in trouble, nor is it difficult to understand why the US economy and government is in trouble. The difficult part is figuring out what the rest of us can do to protect ourselves when things really get ugly. (So far the short list includes paying down your debt and reducing exposure to risky investments.)

Wednesday, October 18, 2006

August Treasury International Capital Flows

TIC data for August came out yesterday, showing a remarkable surge in foreign buying of US securities. According to the latest release, Net long term flows were as follows:
May = $67.0 billion
June = $75.5 billion
July = $32.9 billion
August = $116.8 billion

Treasury purchases saw the sharpest rise, but Agencies and corporate bonds also saw big inflows:

The buying was spread across many countries:
Japan added $7.6 billion in August
China added $8.7 billion
Canada added $4.9 billion
Brazil added $11.5 billion
The UK added $11.1 billion, but most of that was purchased for investors from other nations.

The purchases were typical of China, but Japan had not been decreasing holdings for over a year. Canada has doubled its treasury holdings (to $47.2 billion) over the past year, while Brazil's holdings had hovered around $32 billion until the August surge.

With all this August buying going on, the Dollar strengthened against the Yen and held its own against the RMB. As long as the dollar stays strong, US consumers can continue to consume more than they produce. As long as foreign investors are willing to accumulate US assets, the dollar can stay strong.

Russia has one of the largest foreign reserve positions in the world, but it doesn't show up on the list of Major Foreign holders. Their US holdings are unique in that they are overwhelmingly weighted toward short term debt. Asian nations typically hold large long term debt positions in the US, while European nations and Canada are more balanced between Equities and Long Term Debt.


Japanese treasury purchases could likely be related to the Yen carry trade and are subject to reversal if the speculative climate changes. Russia recently announced that they'll be accumulating Yen reserves, which most countries have shied away from because of low interest rates. The bulk of this is supposed to take place in 2007. Such a move could result in the purchase of tens of billions of dollars worth of Yen, putting pressure on Yen carry traders. I wouldn't expect much of a move before 2007, as hedge fund managers are likely to defend their 2006 gains (and bonus checks) vigorously during the final months of the year.

Monday, October 16, 2006

Squeezed to the Breaking Point

Foreclosures continue to mount in much of the country, according to RealtyTrac. September's national totals were down 0.96% from August, but up 63.5% from the previous September. The 5 States with the highest foreclosure rates in August (with at least 1 foreclosure for every 564 homes) all had significant declines in homes in foreclosure for September, while foreclosures were up 8.5% over August for the rest of the nation.

Anecdotally, many counties are being overwhelmed by the number of foreclosures, causing processing problems, while many lenders are dragging their feet on reporting loan delinquencies as a way of pretending things are OK. It's hard to know exactly how big the mortgage default problem is currently.

California had the biggest affordability problems and the greatest use of high-risk mortgages. With an an 18.54% rise in September on top of a 24.75% rise in August, it appears these high risk loans have squeezed many to the breaking point and are beginning to take their toll on lenders. Florida and Colorado foreclosures dipped by over 20%, but the rates are still among the nations leaders for the foreclosure process. Connecticut (+556%) and Massachusetts (+373%) saw remarkable monthly spikes.

Here are updates of the three charts I posted last month:


Through all of this, the job market remains strong, even if pay levels and job quality aren't keeping up. Foreclosure rates normally spike during recessions when people can't find jobs, not when plenty of jobs are available. Increased debt service levels and high risk lending appear to be behind the current rise in foreclosure rates. According to the Fed's Houshold Debt Service report, several new records were set for debt service and financial obligations ratios in Q2. Those numbers don't include each houshold's share of Federal Debt service, which has been rapidly rising and now sits at over $400 billion per year.

Keeping the US economy growing now requires a steady infusion of new debt. However, as the debt burden rises, the country as a whole becomes a greater credit risk. Foreclosure numbers are one small indication of what is happening on a grand scale to the US economy. The US government is as bad a credit risk as the typical subprime borrower. It's only a matter of time before the whole debt bubble bursts.

Friday, October 13, 2006

Another new trade gap record was set in August. On the whole, I'd have to say that the rebalancing process was not moving forward this summer. A large number of consumers were feeling the squeeze, but the nation as a whole is consuming more than ever before and debt has been piling up higher. Gross External Debt topped $10 trillion in Q2:
Even with oil prices falling sharply during the month, petroleum products were the biggest reason for the rise:

We imported 343.485 million barrels of crude oil in August, up from 321.576 million barrels in July. Among our top 8 suppliers for crude oil:

54.433 million barrels came from Canada
49.845 million barrels came from Mexico
45.322 million barrels came from Venezuela
44.446 million barrels came from Saudi Arabia
27.901 million barrels came from Nigeria
22.876 million barrels came from Iraq
16.435 million barrels came from Algeria
15.686 million barrels came from Angola

Canada, Mexico and Venezuela are in the Western Hemisphere, so it makes sense that they are the largest suppliers.
Saudi Arabia is the world's largest producer, so that makes sense too.
After that, what do the other four have in common? Perhaps it's just me, but I associate those names with civil war and internal violence. Just a coincidence?

A search for "Angolan Rebels" turned up this:
"Angola, too, has diamond and oil wealth of enormous value, yet a quarter of all Angolan children die before the age of five. Angola’s diamonds and oil were used by rebels and the Government to enrich themselves and to buy arms to fight one another at the expense of an impoverished, brutalised population."

Algerian Rebels turns yields 937,000 results, and Nigerian Rebels yields 2.08 million results.

Given the pattern of violence in US oil trading parters and how the violence doesn't seem to bother US oil companies, one has to wonder if the violence in Iraq is all according to someone's plan.

Wednesday, October 11, 2006

A National Housing Slowdown

DR Horton calls itself America's builders and wanted to be the "Walmart" of homebuilders by growing rapidly and entering many smaller markets that other national builders weren't interested in. They are much more national in scope than other builders and charting their net new orders gives a general idea of the slowdown nationally:

The slide accelerated in all regions last quarter, in spite of heavy use of incentives. The Southwest finally went negative, and probably still has the farthest to fall from here. The economy has gone bad in the midwest and has taken housing with it.

Small Ohio and Kentucky builder Domininion Homes reported sales that were off 50% year over year last night. WCI Communities (which builds mostly in Florida) reported year over year declines of 80% last week.

Summing up the regions, we have:
Florida as the worst, the Midwest second worst, and California the third worst.

Speculation was the biggest problem in Florida, and it has caused a violent snapback. Credit expansion put too much money in the hands of speculators.
A bad economy is the biggest problem in the Midwest and I expext the rebalancing process to cause a slowdown in the national economy over time.
Affordability issues and rising interest rates pushed the California market over the edge. Too much easy credit was created through global imbalances and it fueled the sub-prime, no-doc, high LTV explosion.

Builders got carried away in the euphoria of the housing bubble and ramped up their expansion plans just as the market was reaching the breaking point. Now they are getting stuck with too much land and unsold inventory and the resulting debt burden is putting a large strain on their financial situation. Finished homes for sale are still on the rise:

Large incentive packages haven't been enough to keep sales up. Kara Homes may be the first large, privately-held homebuilder to declare bankruptcy in this down cycle, but they won't be the last. Dominion Homes will probably be the first of the publicly traded builders to do so, and many more will probably follow.

Saturday, October 07, 2006

Where's all the Money Coming From?

The Fed stopped counting M3 back in March, but you can still get a pretty good estimate of it by looking at a couple of other numbers they publish. Both of those numbers were rising at an accelerated rate already this year, and really took off in August and September.

Institutional Money Funds rose by about $10.6 billion per month for the first 7 months of the year, but rose by $27.6 billion in August and around $20 billion in September.

Large Time Deposits at Commercial banks in the US were rising at about $25 billion per month for most of this year, but rose by $31.9 billion in August probably even more in September.

The money has to come from somewhere. In this case it appears to be coming from two places. The first being that it is being squeezed out of the hands of average citizens, and the second is that it is being created in the form of new commercial debt.

Consumers aren't borrowing as much as they used to. Consumer Credit was up only $5 billion in August, after rising $8.3 billion in July and $34.7 billion in Q2. Real Estate loans at commercial banks were actually down $0.6 billion in August after rising by about $30 billion per month for most of the year. With home prices stagnating, and consumers already overextended, credit appears to be tightening.

Since they aren't borrowing, they appear to be drawing down their checking and savings accounts to make ends meet. M1, the money people intend to spend, is down $4.1 billion in August, and is down $25.4 billion from a peak of $1393.6 billion in May. M2 is up, but there is a divergence within that measure. Savings deposits were down $9.8 billion in August and are down $41.8 billion from a peak of $3657.3 billion in February. Meanwhile, small time deposits jumped $23.4 billion to $1107.7 billion and Retail Money Funds rose $11.5 billion in August.

On the whole, a lot of new money was created in August but it didn't flow into the hands of consumers. Instead it appears to be in the form of commercial lending. Commercial and Industrial loans at Commercial banks rose by $27.4 billion in August, more than doubling the rate of increase over the past year. I'll credit hedge funds for much of that borrowing and builders for another large portion (as they continue to build homes but have trouble selling them).

All this new money was desperately needed to fund the federal deficit and keep the economy kicking. With many consumers choking on too much debt and leading indicators pointing toward recession, money creation to finance hedge fund speculation and surplus housing appears to be all that our financial system can muster. Neither of those sources of money should be considered sustainable.

Thursday, October 05, 2006

Dollar Update


The dollar slide against the RMB was accelerating and it appeared to be breaking down against other currencies, but then end-of-quarter demand from Yen carry traders gave it a a boost against the Yen. This week China is enjoying aa vacation, so the RMB rate is fixed. In the meantime, the dollar has been catching its breath.

In general, the rebalancing process seemed to take a break in much of August and September. More on that after I see the data from the Fed tonight.