The Turning Point
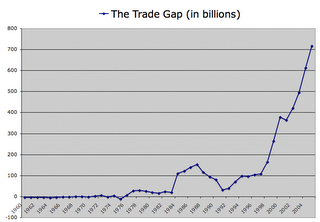
 In 1976 the US came out of a recession to run a trade deficit and has run a trade deficit every year since then. That trade gap has grown substantially over time, resulting in tremendous global economic imbalances. I believe those imbalances will reverse themselves and that the rebalancing process has already begun.
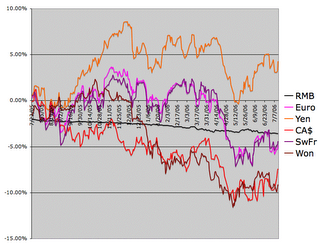
If I had to choose a day when the Rebalancing process officially started, it would probably be 11/17/2005. On the 16th, the dollar hit a short term peak of 87.3509 against an index of major currencies. In my mind the inflated status of the dollar has been the single largest factor behind the growth of the trade gap and global imbalances. As the value of the dollar comes down, Americans will be able to consume less and export more. The following chart shows the Dollar against several important currencies:

October was the peak month for the trade gap, at $66.598 billion. The trade gap is fueled by excessive consumption by US consumers (and government) on one side and by excessive investment by foreigners in US assets on the other side. The two are closely related, but the correlation isn't perfect. Either one could lead a charge or retreat that would influence the other over time.
On the consumer side, mounting debt burdens eventually had to restrict consumption and the first strong signs of this occurred in October. Consumer Credit was flat in November and down 4% in October. Mortgage Applications began a substantial decline in October. Personal Spending slowed in October as well. October was the final big peak for New Home Sales, with a sharp seasonally adjusted decline occurring in November.
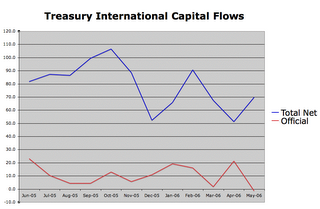
On the foreign investor side, the first signs of a significant slowdown occurred in November. That was a month when the Federal debt rose by a large $65 billion, $32 billion of it the week of 11/14-11/18. Japan was a net seller of US treasuries in November, while the UK picked up an impressive $35 billion. (I continue to believe that UK demand for US treasuries represents highly leveraged hedge funds, possibly linked directly to the Fed.) TIC flow data showed a peak in total net inflows in October and a big decline starting in November and increasing in December:

While consumer credit was tightening, overall credit was expanding (suspiciously). M3 went over the $10 trillion mark in October rising 0.824% for the month (M3 reporting was discontinued in March). Rapid money supply growth is fueling inflation which stresses US consumers and discourages foreign investment, putting the brakes on the trade gap.
January's trade gap of $66.216 billion came close to setting a new record, but another wave of credit tightening in February and March pushed it back down. The federal debt rose $74 billion in February and $101 billion in March. Foreign treasury purchases slowed again and the dollar took another dive. In March the trade gap fell to $61.862 billion.
With foreign buyers shying away from treasuries the voracious appetite of the US war machine is putting a major strain on consumers through tighter credit and mounting inflation. It is also hurting foreign confidence in US assets. July and August are big months for new treasury debt and we can see what's happened to the US markets so far in July. This doesn't bode well for August either. Foreign official accounts have reduced treasury holdings by $13.5 billion over the past 4 weeks, and demand for Agency debt is down from recent highs.
Looking further back, the trade gap hit a high of $58.407 billion in November of 2004, which wasn't topped until June of 2005. It's possible the trade gap will pick up again after the current period of decline. June was a relatively large trade gap month in 2004 and 2005 and probably in 2006 as well. However, I think the real turning point has come and gone. Reseting ARMs in 2006 are putting a substantial squeeze on consumer discretionary spending. Asian central bankers had to see this coming and this probably contributed to their declining investments in US assets in late 2005 and early 2006. The plight of the US consumer is getting worse and the demands of the US treasury are putting a serious strain on the whole economic system. The rebalancing process had to happen eventually. The longer we waited the worse it had to be.

<< Home