Anatomy of a Housing Bubble
MDC Holdings breaks down their data better than any of the other homebuilders and it tells a story of how the builders got themselves in trouble and how bad things will be in the housing sector going forward. This first chart shows year over year percentage changes for a number of important items:
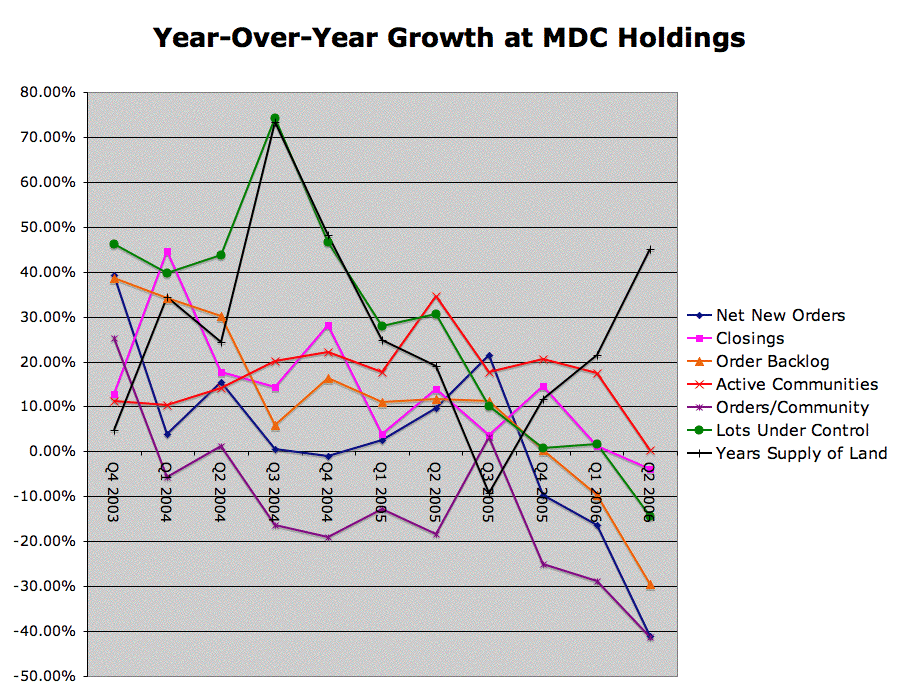
In 2003, the housing market was booming, thanks to record low interest rates and easy lending practices. MDC was making big profit margins on every piece of land they developed. With rapid appreciation in force, the more they bought and the longer they held land, the larger their profits were. Also, the more they grew the easier it was for executives to justify higher salaries and bonuses. They got caught up in the euphoria and from Q4 2003 to Q3 2004, MDC went on a land buying binge that almost doubled lots under control. What makes sense for executives often runs counter to what makes sense for long term investors and the health of the economy.
The surge in land acquired in 2004 led to a surge in new communities opened in 2005, but new sales and closings grew at a more modest rate during 2004 and 2005 and sales per community actually declined as too many developments came on the market nationally. The quantity of developments increased sales numbers nationally, but an inventory problem was clearly brewing:
After a final surge in Q3 2005, MDC's sales hit a wall in the latter part of Q4 2005 and have tumbled into 2006:
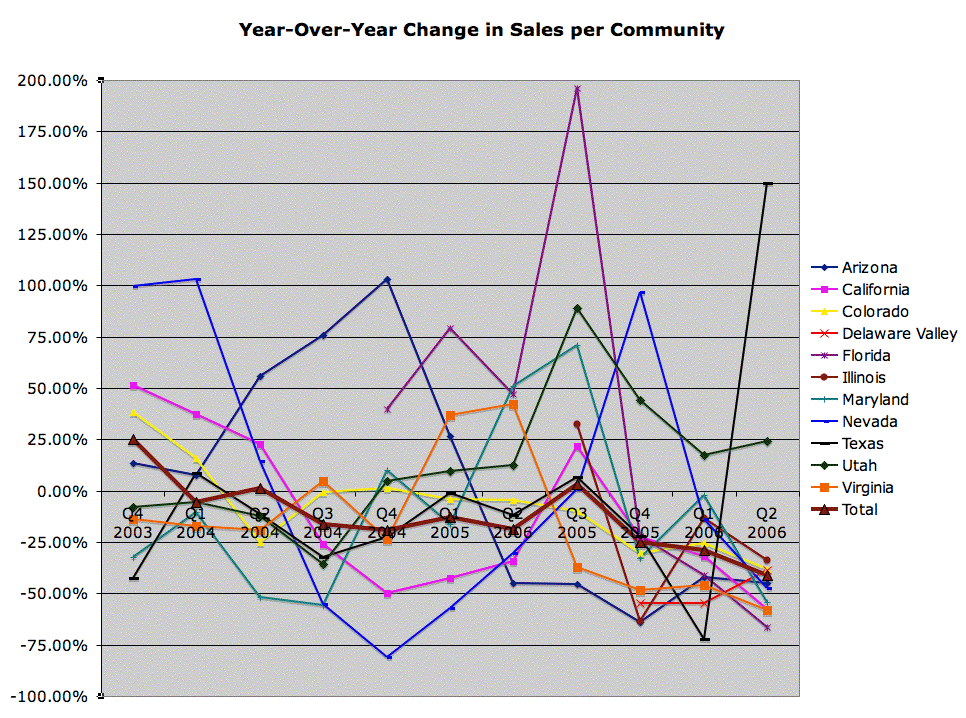
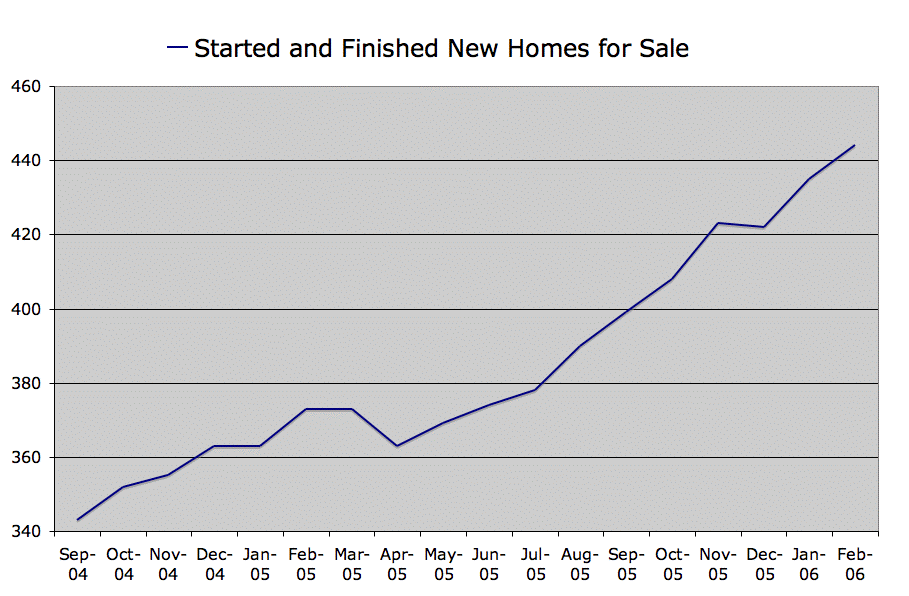
The number of unsold new homes has continued to rise through 2006, as national homebuilders act on plans made when sales were stronger. Regionally, the slowdown hit first in the big bubble areas of California and Nevada had big initial declines, but bounced in late 2005, only to tumble again in 2006. Arizona has been in a steady decline since Q2 2005, Virginia's decline started the next quarter and pretty much everything fell off the cliff starting in Q4 2005. (Texas is an aberration because MDC is exiting the region as quickly as they can, and Utah is still living in fantasyland for now.)
Because builders have far too many communities under development and land on their books things will continue to get worse. MDC has actually been very conservative compared to most other builders when it comes to land acquisitions. Q3 2006 will provide an especially harsh comparison because of the surge in Q3 2005.
Referring back to the original chart:
MDC began canceling land options and stopped acquiring new land. They've also held off on opening up some new communities to keep costs down. MDC is responding more quickly than most of their peers, but their years supply of land based on sales has taken off because of falling sales. The average national builder went from having about 3 years worth of land under development at normal rates of sales to having 5 or 6 years at extreme rates of sales in a massive land grab (MDC went from about 2 to about 3). As sales decline, that turns into 10 years of supply or more. Pursuing rapid growth strategies was great for short term stock appreciation, but once the bubble started bursting the long term risks were exposed. Builders with too much land and debt on their books won't be able to exit without taking huge losses or will get buried under the weight of their debt burden.
Profits are still high at homebuilders because closings lag new orders and backlog. They also capitalize much of their interest expense, so on their books land is still appreciating even if the market value of the land is tumbling. Q3 and Q4 are usually the biggest quarters for closings, but will be down sharply year over year this time for most builders. Two small builders (Dominion and Levitt) reported losses of the first half of 2006. Beginning in Q1 of 2007, I expect almost all builders to report losses. Dominion may be bankrupt by then, and I expect a string of bankruptcies to follow until finally the supply of housing is back in line with demand.
That could take many years because builders are have been flooding the markets with spec houses and condo towers just as the economy begins slowing. Housing booms and busts typically last about 5 years each. This boom, however, lasted about 10 years and was much larger than any past boom. The resulting bust should be about the same size proportionally:

posted by RodgerRafter @ 8:53 AM
![]()
![]()

<< Home