Economic Rebalancing

The global economy is horribly out of balance, with the United States going deeper into debt each year as a result of a huge trade gap. This blog describes the process of global economic rebalancing. If you have any comments or questions about the posts here, please don't hesitate to use the comments section.

Friday, July 28, 2006

Extended Weekend

I'll be away for the weekend. Next post will probably be next Wednesday.
There's lenty of reading material in the July archive if anyone gets bored.

Thursday, July 27, 2006

Hedge Frauds and Pirate Equity

I suspect that hedge funds and private equity funds are the answer to one of the biggest mysteries of the current rebalancing process: Why are components of M3 growing at a rate of about 10% even though consumer and mortgage debt have slowed their growth?

Hedge Funds
Most classes of hedge funds, including private equity, borrow great sums of money into existence in order to leverage their strategies. Part of this is because many hedging strategies are low risk and low return by nature, and extreme leverage is the only way to make the trade strategies viable. Another part of this is because the hedge fund compensation scheme rewards managers for taking large risks with their clients' money - managers collect a large percentage of paper gains, but losses are born totally by investors.

The money borrowed by hedge funds flows directly into the financial markets as securities are traded and typically ends up in an institutional money market account somewhere. These accounts mostly purchase treasury, agency or corporate debt to fund government spending, mortgage borrowing or corporate activities like share repurchase programs.

Hedge fund activity is key to meeting the short-term needs of government and the stock market, even though it introduces great long-term risk into the total economy. Hedge funds can be wiped out in a short amount of time. The leverage they employ can result in fantastic paper profits, or it can result in rapid losses. The story of Long Term Capital Management is an important cautionary tale. If not for a $3.5 billion rescue package arranged by the Fed, over $100 billion in borrowings by the firm would have been repaid or defaulted on as the firm liquidated its holdings.

The hedge fund world has grown manyfold since 1998, with about $1.2 trillion in estimated assets now under management. Many funds have been employing high-risk strategies in the attempt to generate attention grabbing returns, boost their assets under management and collect large fees. In a volatile market, the total amount of assets wiped out and the size of the margin calls could be much larger than those faced by LTCM alone. While the money supply and economy have benefited from the growth of the hedge fund world, the potential for a rapid contraction is increasing all the time.

Most hedge funds performed well when the yield curve was steep and borrowing costs were low. When rates began rising in 2004, returns began declining. Hedgefundresearch.com has an index that estimates average hedge fund returns of 13.39% in 2003, 2.69% in 2004, 2.72% in 2005 and 2.19% so far in 2006. At best, those returns fail to keep up with inflation and benchmark indices. At worst, those returns are inflated by accounting tricks and increasing leverage and risk.

The rapid growth rate of 2003 has tapered off for many hedge funds, partly due to diminishing returns, partly due to declining investor interest and partly due to limited investment opportunities. The following chart, based on SEC filings, shows how growth has slowed for 4 large funds that I track:


Private Equity
Private Equity funds are currently the hottest area of the hedge fund world. They are generating tremendous liquidity and boosting asset prices through their leveraged buyout operations, but this is only a temporary benefit. Soon the wreckage left behind by private equity funds will be a major problem for the economy.

A leveraged buyout (LBO) occurs when a party borrows enough money to purchase all of the shares of a publicly traded company in order to take it private. LBOs introduce a lot of new money into the money supply and the stock market, but the newly private companies operate under a massive debt load and are vulnerable to economic downturns.

Leveraged buyouts are becoming hot again, as they were in the early 1980s, but there are some big differences this time. Back then, after the long bear market of the 1970s, beaten down stock prices made many companies a bargain for buyout firms and management teams. Executives could also run the stock prices into the ground with negative news and earnings reports and then make buyout offers at low prices. After the buyout was complete, the companies would suddenly become much more profitable and the executives would become extremely wealthy. Hostile takeovers became common for companies with low share prices as outsiders sought to exploit the situation whenever management didn't have the guts or gall to do it themselves, and "greenmail" became popular as a way to extort company money when management teams didn't want to give up their control of a company.

The LBO game worked extremely well for several years, but as the size and quantity of deals increased, and as market valuations rose, the profitability of LBOs declined. Buyout teams went for increasingly risky deals as competition among them increased and suitable targets decreased. Spectacular blow-ups late in the cycle caused a huge scandal, leaving many junk bond investors holding the bag and landing key players in jail.

The early success of private equity firms in this cycle was largely achieved on merit. As more firms have entered the arena, they are engaging in more questionable deals. Now stock prices are much higher in terms of price to earnings and other valuation measures, and good targets are becoming harder to find. To make an LBO profitable private equity firms need to exploit other victims, rather than just existing shareholders. The new LBO strategy is to find a company that has a lot of cash or assets that can be easily sold. The LBO team borrows enough money to buy out existing shareholders, then lays off employees, neglects maintenance and customer service, and otherwise destroys the long term value of the company in order to milk as much cash as possible. The exit strategy for private equity firms is usually to take the remains of their company public in a big IPO. As long as there are unsuspecting mutual fund managers out there who are either oblivious to the rules of the private equity game or who think they can run up asset prices in the short term, then private equity firms can exit unscathed. They take their profits and move on to the next set of victims.

However, a big problem is brewing in the private equity field as more and more firms enter the game. Pension plans, desperate to make up for poor returns of the past 6 years, are foolishly investing billions of dollars in private equity schemes late in the cycle. The number of IPOs will grow too large, just as it did when the technology bubble burst in 2000. There won't be enough clueless or greedy buyers for the IPOs. The results will be very bad for pension funds, the stock market and the economy as a whole.

Wednesday, July 26, 2006

The Perverted Yield Curve

There has been some hype in the media about the yield curve inverting and how that often leads to a recession. I have three main points to make:

First, the yield curve has not inverted, it has been perverted.
Second, the US treasury yield curve has become perverted by huge distortions and imbalances in the greater global economy.
Third, it's all relative.

With regard to the first point:
The following chart shows the yield curve at certain key points in time:

1/2/01 was when the curve was most inverted before the 2001/02 recession.
6/13/03 was when rates were lowest, during the deflation scare.
6/29/04 was when the curve was steepest, one day before the Fed started its current series of rate hikes.
1/17/06 was when the curve became most inverted early in the year.

When prices change, there is money to be made. It follows that those with the power to move rates have the power to make money for the well positioned. Some might argue that fluctuating interest rates reflect uncertainties in the economic landscape. I contend that large movements in interest rates are controlled to meet the political and financial goals of key institutions. I use the word "perverted" to describe the curve, rather than "inverted" because I think the yield curve is intentionally distorted by the Fed and Wall St. institutions.

Let me suggest that the yield curve became "inverted" because the Fed intentionally tightened interest rates too much during the 2000 presidential campaign to help undermine the Democratic candidacy. With the stock market crashing, the Fed continued to boost interest rates into May and kept them high until after the election. Soon after the election was over, the Fed conducted 2.5% worth of rate cuts in 5 months.

Let me suggest that the yield curve became lowest in 2003 to help stimulate the economy for the 2004 campaign. The stock market had bottomed in October of 2002, but the Fed cut rates another 0.75% to absurdly low levels and stoked fears of deflation. As ridiculous as that sounds in the era of fiat money, the markets reacted to it.

Let me suggest that the yield curve became steepest in 2004 to help stimulate the hedge fund industry as a way to boost Wall Street trading volumes and profits. Short term profits became automatic as fund managers were able to borrow at ultra low rates an invest in any asset class imaginable. Of course this created huge long term risks, as there are always too many managers eager to seize short term profits.

Let me suggest that the curve has become "perverted" now as the Fed desperately seeks to prop up the dollar without wrecking the carry trade excesses of the last 3 years. The carry traders have their backs to the wall, as their borrowing costs have risen and they can't afford to have bond prices fall on rising long bond yields. Meanwhile, the US government's debt service has risen to over $400 billion per year. Meanwhile, the mortgage industry is feeling the squeeze as borrowers get scared away by rising rates. Long bond rates must stay low, or the system unravels. Active intervention is needed to override natural market forces.

The 2000-2001 inversion correctly forecast falling short-term rates into 2003, but the current perversion isn't really forecasting anything, as far as I can tell. One could argue that the curve is calling for an extended period of unchanging interest rates after a few more hikes, but then the entire yield curve would still be too low relative to inflation.

In recent months, interest rates have been allowed to move up gradually. I expect that a rapid rise would break the system, while a slow rise keeps the derivatives markets intact and the dollar afloat. Here's a chart of the yield curve at various times this year:

The curve has steepened and perverted alternately as pressure has built on long bond yields and then subsided. January 17th, saw the maximum perversion before treasury demand in February and March drove rates up. Now the curve is perverted again, but that may be difficult to maintain. We'll see how Paulson does as head of the treasury.


With regard to the second point:
My take is that yields are suppressed by artificial demand on the short end and in the 5-10 year bonds and by limited supply on the long end. There may be many potential explanations for this, including:

1. Derivatives underwriters may have high demand for 5-10 year treasuries. There has been an extreme expansion of the mortgage market based on surging home prices, 0% down mortgages and cash-out refinancing. This has mainly been fueled with short term financing and many of the investors in mortgages have sought to hedge away interest rate risk by purchasing interest rate swaps and other derivatives. The underwriters have then sought to balance their own risks by purchasing 5-10 year treasuries. This has had the added effect of keeping mortgage rates down, with fixed rate mortgage rates linked closely to 10-year treasury yields.

2. The Government has created a shortage of supply on the long end. The US government has been seeking to bring down interest expense on the national debt by issuing more short term securities relative to long term securities. They've done this to the extreme point that the entire range from 6-months to 10-years is now essentially flat. There should be much more risk associated with the longer term bonds based on the risks of rising inflation and even potential default in a nation with over $8.4 trillion in debt and a $700+ billion current account deficit. Suppressing long term yields through reduced supply creates further risk of higher rates in the future as too much debt will be rolling over in near future. The government is sacrificing future security for lower interest payments today.

Composition of Marketable Securities
November 2005...November 2000
Bills............983 B.......682 B
Notes.........2339 B....1590 B
Bonds........516 B.......629 B
TIPs............327 B......121 B
FFB................0 B.........15 B
Total..........4166 B.....3037 B
% Bills........23.6%......22.5%
% Bonds....12.4%......20.7%
Bills are 1-year or less when issued.
Notes are 2 to 10 years.
Bonds are more than 10 years.

There is an added short term economic benefit to suppressing longer term yields in the way the mortgage financing and hedging cycle gets a boost, prolonging the housing boom. Of course the potential for sharply higher rates in the future means that a subsequent housing bust could be much worse.

3. Yield chasers could be driving demand for longer term notes and bonds. Pension managers needing to produce high returns to meet payment expectations can come closer with higher yielding long term notes, even if the risks are greater. Similarly, mutual fund and hedge fund managers hoping to outperform their peers can do better most of the time by taking larger risks.

4, 13 and 4-week bills could be a low-risk and flexible storage of wealth for foreign investors more than a pure investment. Many investments in the US economy have been net losses recently for foreign investors, but the total amount of wealth outside the nation continues to grow as the trade gap continues. From a national perspective, foreign governments and central banks may see economic growth and profitability as the main goals, and through willingness to accumulate US debt and invest it at low yields they further their narrower goals. It doesn't matter if the earnings from their wealth are high as long as the earnings from their exports are high.

5. Surplus money supply may be boosting demand in the short durations. Extreme amounts of money creation by the Fed and banking system and a lack of suitable investment opportunities have forced surplus cash into money market accounts, which in turn is largely invested in short term treasury bills.


The more money the Fed helps create, the more money is forced into treasuries, causing the "conundrum" of low treasury yields in spite of a rising federal funds rate. The 4-week is now about 75 basis points below the federal funds rate even though more rate hikes are expected going forward. Has this ever happened before?

The yield is out of whach from 6-months to 3 years, but why would anyone want to buy those bonds at these prices? It takes a hidden agenda to want to buy the short-term and long-term treasuries, and there isn't a very good reason for big players to invest in those middle range options.


And finally, with regard to the third point:
The Fed did a study awhile back and discovered that the best predictor of recessions was the inversion of the yield curve. OK, fine, but:

1. An official recession is an arbitrary measure of a slowdown in economic growth (i.e. 2 quarters of negative real growth). If GDP slows to 0.1% for 20 straight quarters, that's not officially a recession, but it sure is a bad economy. What really matters (at least in the short term) is the rate of growth, not the term recession.

2. Inversion is also arbitrary measure. When the yield curve tightens (whether or not it inverts) that discourages money supply expansion by rendering the carry trade less profitable. That tends to reduce the rate of economic growth. (This makes the continued rapid expansion of the money supply especially suspicious.)

3. There are of course other important measures of economic stimulus that can outweigh the yield curve. The most important ones, IMO, are money supply expansion and the amount foreign investment capital flowing into the country. Both of those were very high in 2004, and based on the government's reports (if you believe them) they trumped the tightening of the yield curve to produce continued economic growth. With foreign investment weakening, however, money supply growth has been the primary fuel keeping the economic engine running. The longer term cost of this is inflation, however, which can wreak widespread economic damage if it gets out of hand.

Tuesday, July 25, 2006

Stock Market, Treasuries, Dollar, Oh My!

Since the rebalancing process got rolling the Fed has had to perform a difficult juggling act with the stock market, treasuries and the dollar. With the consumer driven economy beginning to sputter, and without enough support from foreign investors there is downward pressure in all three areas. Below I've include a chart I created based on data for 10-year treasury yields, the Dollar in Euros, and the Nasdaq-100. It provides a rough measure of the relative strength in the three areas and shows how the rebalancing process is eroding the wealth of American investors:

The average of the three stopped moving up in November, about the time I've chosen as the official start of the rebalancing process. Not surprisingly there was a bit of a lag before the financial markets felt the full weight of shifting capital flows. Beginning in late January, the average of the three started moving down somewhat rapidly, with treasuries suffering first, the dollar second and stocks third.

A typical diversified US investor does poorly if his stocks or bonds fall in price or if the value of his dollar denominated assets decline against other global assets. The investor might not feel it right away, but a declining dollar eats away at his wealth through inflation. That's my rationale for using an average of all three measures as a gage of how the US financial markets are performing.

The Fed doesn't want to see any of the three fall rapidly because it could cause a financial crisis. If treasury prices fall too rapidly then a sudden shock would hit the economy in interest rate sensitive sectors (although a long term decline could be just as damaging). Perhaps more importantly in the minds of the Fed chairman, a quick movement in interest rates could bankrupt highly leveraged derivatives players like JP Morgan and potentially cause panic in the derivatives markets. That would be really bad for bankers.

If the stock market takes a dive then the Fed will face trouble on several fronts. The economy will slow via the wealth effect. There will be a political uproar over falling stock values. Many hedge funds will get slaughtered, deleveraging the money supply as they go. The nation's pension plans will be exposed as horribly underfunded ponzi schemes, leaving corporations and government entities deep in the hole. The average working American would suffer greatly.

If the dollar falls rapidly, than the rebalancing process will accelerate and compound the Fed's problems with treasuries and stocks in the near future. Inflation will also pick up with the Fed taking the blame. If the dollar appears weak it could also trigger a flight out of US dollar based assets, again compounding the Fed's problems. Former Labor Secretary Robert Reich suggests that Hank Paulson gave up being CEO of Goldman Sachs to make sure the dollar's decline is orderly. I agree and think he has his eyes on interest rates as well.

All of the above problems will probably be felt to a substantial degree in time, but the Fed is hoping that none of them will be felt strongly enough to get people so upset that it undermines the power of the banking cartel. The best they can hope for is to let all three continue to decline gradually together. It appears that this is the way the Fed is playing things. Whenever one market gets dicey they talk it up at the expense of the others. When the dollar was falling, they began talking tougher about interest rates and inflation fighting. This caused longer term rates to rise, so they let stocks to fall with talk of a slowing economy and an eventual pause. Of course the Fed always understates the current level of inflation and overstates the long term strength of the economy, as false confidence is the main thing keeping the whole system afloat.

Allowing the money supply to grow rapidly has helped the Fed slow the rate of decline in stocks and bonds, but has created greater inflationary pressures for the near future. Increased liquidity has been the easy and short-sighted way to boost stock prices and pervert the yield curve (tomorrow's topic). Dollar weakness has been tempered by raising short term rates to attract foreign currency arbitrage players, but that will create even bigger problems when the arbitrage equations shift.

Based on the policy decisions of the Fed up until now, and the slowness of the rest of the world to realize the challenges of the rebalancing process, I'm expecting the stock market, treasuries and the dollar to accelerate their declines going forward. A financial crisis in the United States is not in the best interests of foreign investors or the global economy. Through awareness and teamwork the central bankers of the world could engineer the rebalancing process in a manner that minimizes financial turmoil. However, if the banks continue to try and protect their own narrow interests, the US and global economies could face dramatic shocks.

Monday, July 24, 2006

The Turning Point

In 1976 the US came out of a recession to run a trade deficit and has run a trade deficit every year since then. That trade gap has grown substantially over time, resulting in tremendous global economic imbalances. I believe those imbalances will reverse themselves and that the rebalancing process has already begun.

If I had to choose a day when the Rebalancing process officially started, it would probably be 11/17/2005. On the 16th, the dollar hit a short term peak of 87.3509 against an index of major currencies. In my mind the inflated status of the dollar has been the single largest factor behind the growth of the trade gap and global imbalances. As the value of the dollar comes down, Americans will be able to consume less and export more. The following chart shows the Dollar against several important currencies:

October was the peak month for the trade gap, at $66.598 billion. The trade gap is fueled by excessive consumption by US consumers (and government) on one side and by excessive investment by foreigners in US assets on the other side. The two are closely related, but the correlation isn't perfect. Either one could lead a charge or retreat that would influence the other over time.

On the consumer side, mounting debt burdens eventually had to restrict consumption and the first strong signs of this occurred in October. Consumer Credit was flat in November and down 4% in October. Mortgage Applications began a substantial decline in October. Personal Spending slowed in October as well. October was the final big peak for New Home Sales, with a sharp seasonally adjusted decline occurring in November.

On the foreign investor side, the first signs of a significant slowdown occurred in November. That was a month when the Federal debt rose by a large $65 billion, $32 billion of it the week of 11/14-11/18. Japan was a net seller of US treasuries in November, while the UK picked up an impressive $35 billion. (I continue to believe that UK demand for US treasuries represents highly leveraged hedge funds, possibly linked directly to the Fed.) TIC flow data showed a peak in total net inflows in October and a big decline starting in November and increasing in December:

While consumer credit was tightening, overall credit was expanding (suspiciously). M3 went over the $10 trillion mark in October rising 0.824% for the month (M3 reporting was discontinued in March). Rapid money supply growth is fueling inflation which stresses US consumers and discourages foreign investment, putting the brakes on the trade gap.

January's trade gap of $66.216 billion came close to setting a new record, but another wave of credit tightening in February and March pushed it back down. The federal debt rose $74 billion in February and $101 billion in March. Foreign treasury purchases slowed again and the dollar took another dive. In March the trade gap fell to $61.862 billion.

With foreign buyers shying away from treasuries the voracious appetite of the US war machine is putting a major strain on consumers through tighter credit and mounting inflation. It is also hurting foreign confidence in US assets. July and August are big months for new treasury debt and we can see what's happened to the US markets so far in July. This doesn't bode well for August either. Foreign official accounts have reduced treasury holdings by $13.5 billion over the past 4 weeks, and demand for Agency debt is down from recent highs.

Looking further back, the trade gap hit a high of $58.407 billion in November of 2004, which wasn't topped until June of 2005. It's possible the trade gap will pick up again after the current period of decline. June was a relatively large trade gap month in 2004 and 2005 and probably in 2006 as well. However, I think the real turning point has come and gone. Reseting ARMs in 2006 are putting a substantial squeeze on consumer discretionary spending. Asian central bankers had to see this coming and this probably contributed to their declining investments in US assets in late 2005 and early 2006. The plight of the US consumer is getting worse and the demands of the US treasury are putting a serious strain on the whole economic system. The rebalancing process had to happen eventually. The longer we waited the worse it had to be.

Sunday, July 23, 2006

I Don't Like Gold as an Investment

Gold has outperformed the S&P for the last 6 years, or should we say that the S&P has underperformed gold. A lot of people are excited about that and justify gold and gold miners as an investment mainly because everything else is so unstable. But how stable is gold? Its value is purely a function of psychology. It doesn't earn you anything, like other asset classes.

In my mind, gold is a tool for speculators. One may be able to predict its movements based on macro-economic projections, but on the other hand it is especially ripe for manipulation to clean out small traders and force them into losses. Since there is no fair value for a commodity with only psychological value, Wall St. can squeeze the traders, while central banks can squeeze people who bet against their fiat regimes.

Former Goldman Trader Mark Lapolla blogged some good comments on gold here: Sixth Man Research: Don't Overthink Gold

The whole piece is good, but a couple of quotes in particular caught my eye:

"To economic and market forecasters, gold--and its ratio/relationship to other things--has been THE inflationary expectations indicator."

This bears watching, as I think inflationary expectations are very low right now, relative to the potential inflation that exists in the money supply right now. If confidence is lost in the dollar, a flood of currency could be returned to marketplace unleashing a tremendous wave of inflation in commodities, equities and property (going counter to the loss of faith in equities and property). This process has been going on for the past couple of years, but it could accelerate dramatically. Gold may be an early indicator or it may be suppressed.

"Gold mostly goes up because it's rising marginal price lends credence to its' mystery, and it falls, mostly because its' falling marginal price scares speculators."

This quote describes the psychology of the metal very well, in my opinion.

Saturday, July 22, 2006

Wall Street's Risk Game and Rising Volatility

As the global rebalancing process continues, much stress will be put on the American financial system. The great depression began with a major collapse of the banking system, with small depositors losing their life savings and banks losing their ability to lend. While our government has taken measures to protect against the specific problems that arose in 1932, the financial sector has found ways to magnify the total systemic risk manyfold. How the financial system handles a rise in volatility and risk aversion will be well worth watching in the coming months.


Businessweek ran an article last month entitled Inside Wall Street's Culture Of Risk that provides a nice overview of how the big investment banks have shifted their business models toward generating trading profits, while at the same time introducing tremendous systemic risk to the greater economy. As this is a mainstream media article, there is a conscious effort to avoid stating how bad things really are or make accusations as to the hidden motives of the players involved.

For those who don't have the ability to read between the lines, I'm glad to provide my own observations and context. I suggest opening the article in another window and reading the whole thing while following along as I quote from the article in italics and add my own comments:

"Wall Street has always been about taking risk. But never has the "R" word been such an obsession for the men and women who rule the nation's biggest investment banks."

Never have the profits been so large. Never have the government and fed been so thoroughly controlled by Wall Street. Never has it been so easy to transfer the full burden of Wall Street risk taking to Main Street.


"Goldman Sachs' CEO Henry M. Paulson Jr. has led the charge. Major Wall Street firms have watched with envy as Goldman has repeatedly racked up record earnings on the strength of its trading business."

And now he's taken on so much risk at Goldman that he had to take over the reigns himself as chief plunge protection officer. And he traded in 10s of millions in annual compensation for a government salary. Things must indeed be getting interesting on the street.


"Now, virtually all banks are making huge bets with their own assets on many more fronts, and using vast sums of borrowed money to jack up the risk even more."

If it was just their own money it wouldn't be so bad. However, they've created tremendous systemic risk. Everyone they've borrowed from is at risk. All of their counterparties are at risk. Everyone who works for their counterparties is at risk. The whole economy is at risk.


"What's more, banks are jumping into the realm of private equity, spending billions to buy struggling businesses as far afield as China that they hope to turn around and sell at a profit."

Buy the whole business and you can book it almost any way you like. Turn a money losing stock bet into a guaranteed profit overnight... never mind the bloodstains from the red ink.


"If banks succeed, they'll rack up even bigger earnings. But if they borrow too much money for their trades or take on more risk than they can manage, the wreckage could be considerable."

Success on past bets has largely been achieved by taking on ever larger new bets. It's a big ponzi scheme, and the question isn't one of whether it will work, but rather one of how long it will work.


"As the banks trade in ever-more-obscure products with ever-more-opaque clients such as hedge funds, observers worry that they might not be able to settle their trades in the event of a market shock, intensifying the damage."

That's putting it mildly.


"Suspicions are rising that bank traders are acting on nonpublic information gleaned from their clients."

Count the Fed and the Treasury Department among their clients, and that's probably the mildest way that the game's been rigged.


"The Securities & Exchange Commission has "very active examinations and investigations under way," says Lori A. Richards, an agency director."

There you go, Lori. Find us a couple of scapegoats so that we can pretend the rest of the crowd isn't robbing investors blind.


"Yet for all the risks they're taking on, banks insist they're safer than ever. They've hired many of the greatest mathematical minds in the world to create impossibly complex risk models."

It takes a really good theoretical mathematician with no real clue as to how the market works to come up with a model that says everything is OK.


"And traders have been feathering banks' nests for five years."

That's why the next Goldman boss was their most successful trading guy.


"They've produced record earnings and boosted asset bases to unheard of sizes, making even bigger bets possible."

That's not just the model for Wall St. It's the model for the entire US economy: Book false profits... leverage up... book more false profits... leverage up...


"The degree to which risk management has evolved in the past few decades is astonishing, say analysts."

What's astonishing is that the American public has allowed Wall Street to risk their own security.


"Some on the Street argue that such confidence is misplaced, and that the relative stability in the global markets since 2003 has lulled traders into a false sense of security."

That false sense of security is the only reason for having confidence.


"One senior bank executive thinks so. He worries that at any moment volatility could spike to levels never seen before."

Read volatility as a collapse in asset prices and the rapid disappearance of wealth. Why worry? Better just plan for that rise in "volatility."


"How the markets will respond to such an event "is up in the air," says Leslie Rahl, president and founder of Capital Market Risk Advisors Inc., a New York-based consultancy. That's because banks are dealing more with unpredictable clients like hedge funds and in less familiar financial products like derivatives of derivatives."

"Up in the air" or "up in smoke?"


"On the very next page of the JPMorgan report, the bank tells investors that losses could have soared to as much as $1.4 billion over, say, a four-week period last year if an abnormal event had occurred."

Not quite what the report actually said. Rather, they said " Based upon the Firm's stress scenarios, the stress test loss (pre-tax) in the IB's trading portfolio ranged from $469 million to $1.4 billion..." Of course JPM designs their own scenarios and I doubt they included the full potential of their derivative hedging bets blowing up on them when "volatility" soars.


"Goldman's Paulson was asked to talk about his readiness for a big blow to the financial system. Paulson issued a litany of warnings. The main risk measure Goldman discloses, VAR, "always assumes that the future is going to be like the past," he said. And even though the bank regularly uses many different models to test its resiliency to various disaster scenarios, no one can correctly predict where the next disaster will come from."

Sounds like Greenspan saying that nobody can correctly predict when a bubble is forming. Why'd you change jobs, then, Hank? Dedication to public service?


"banks' aggressive moves into trading threaten to scare off clients who wonder where they will rank if a panic triggers a sell-off. Will the bank perform its fiduciary responsibility to its client and execute its trades, or will it cover its own hide?"

When the markets are going craziest, it provides the best cover for Wall Street firms to screw their clients.


"Big firms can no longer subsist on underwriting or stock and bond trading as the combination of more rivals and cheap electronic trading drives down profit margins. "Wall Street doesn't get paid to not take risk anymore," says Merrill Lynch & Co. financial-services analyst Guy Moszkowski. The big investment banks add value by "absorbing the risk that their clients are looking to get rid of.""

And risk these days is really just a euphemism for profiting through accounting fraud.


"Businesses that once accounted for most of the profits at investment banks are now viewed more as gateways that lead them into the lucrative land of risk."

The only way to stay in the game is to play along.


"More surprising, banks are also regularly agreeing to buy huge blocks of stock from trading clients even when they know they will likely lose money on the trade. It's a high-risk, low-reward endeavor designed to keep clients coming back to pay for more lucrative business in the future."

It's also a good way to keep the markets propped up and prolong the game a little longer.


"In the bond markets, money managers ring up traders routinely and ask them to bid on messy multibillion-dollar portfolios of bonds and other financial products with expiration dates ranging from 2 to 10 years. "You have a trader committing in one or two minutes to a trade that could lose or make tens of millions of dollars," says Thomas G. Maheras, head of capital markets at Citigroup."

That's an interesting turn of events. It used to be the traders calling the managers and ramming trash down their throats. Now the traders don't mind eating the garbage that the managers are dumping back on them. Heck, it'll all blow up soon anyway. Give me any old trade so I can book a profit, please.


"Risky though the trading may be, it's the forays into private equity that keep many risk managers awake at night. Fully formed companies are the hardest assets for banks to get off their books if things go wrong; just try selling a pipeline in the middle of a financial panic."

Risky in the real world, yes, but easiest to fudge in the fantasy land of financial reports. And that's the world that matters when bonus time comes around at the end of the year.


"Wall Street moves in cycles of excess. Before the current cycle turns, the odds are good that at least one bank will take things too far. That's what happened in the '80s, when banks churned out an array of new products like junk bonds and created whole new markets for them, then abused those markets for their own ends. It happened again in the '90s as bankers cashed in on the Internet bubble. "There's always someone who doesn't see that the turning point has been reached," says Frank Fernandez of the Securities Industry Assn."

Ummm... "one" bank?


One thing the article doesn't mention is how market volatility decreased dramatically from 2002 to 2005. Meanwhile, Wall Street ran up great profits by selling derivative protection against volatility. Fed policy of letting banks create almost unlimited liquidity amidst a backdrop of very slowly rising interest rates has been extremely helpful to the firms absorbing risk through the derivatives markets. Consequently many firms have taken on tremendous amounts of risk, jeopardizing the stability of the entire system.

I don't care for the VIX or other wall street measures of volatility, opting instead to calculate my own measures based on daily highs and lows. Here's a chart giving an indication of what I've seen volatility do in recent years:


Volatility began a significant uptrend about the time Japan began reducing its treasury holdings. The market appears to be getting away from the tight control of the Fed and its main constituents. Volatility will continue to be a major indicator for me of how much trouble is brewing in the financial system.

Friday, July 21, 2006

And Now For Some Good News

The good news is that the economy is creating lots of jobs. If we are going to make it through the rebalancing process without going into a depression, keeping the number of jobs up will be important. Some sectors (housing, mortgage lending, retail) will likely suffer, while others are likely to grow.

Many blogs and websites in the Economics Underground downplay the strong growth in the job market. There is a deep rooted and justified mistrust of government statistics, which are often manipulated for political purposes. Nevertheless, I believe that the numbers of jobs being created are more or less legitimate. The change in methodology to add the Birth/Death Model gave W some artificial job gains to boast about in the 2004 presidential campaign, as a previously uncounted category of hypothetical jobs was added to the totals. But now the model is just a seasonally based guess at the number of new jobs that won't be reported to the goverment until the next July or January. People who try to claim that the economy is actually losing jobs because of the B/D adjustment don't understand how the number is derived.


What is more important to me than the total number of jobs is which sectors are seeing the job growth:

The Oakland Police Department is hiring. They have a huge banner on their headquarters facing highway 880. With the murder rate up 80% in Oakland over last year there is definitely a need for more cops. The San Francisco Police Department is running ads on local buses looking for new cops. An SFPD dispatcher I know says the most calls they receive are for relocating homeless people from people's doorsteps and for suspected terrorism tips (i.e. 4 Arabs in a car together). The prison population in the United States rose by about 1000 inmates per week from 6/30/04 to 6/30/05 to reach a total of 2,186,230. Sounds like law enforcement is a growth industry.

Other sectors are growing too. Mining jobs increased by 9.6% from 6/05 to 6/06, which isn't surprising given the huge demand for raw materials coming from China. "Rip it and ship it" should be a growth theme as the rebalancing process continues.

Then there's real estate, which added 52,300 jobs in that same time period. Good thing there are now over 1.5 million people working in real estate because selling a home is becoming very hard work. Whether anyone can actually make a living selling real estate will be the interesting thing to see.

Retail jobs are down, year over year, and that situation is probably going to get much uglier. One way or another, US consumption of imports is going to have to decrease relative to exports.

In spite of the strong job market, many (I believe most) workers are losing ground to inflation. Official government statistics show compensation rising as fast as inflation, but I believe actual inflation for working people is understated and compensation is overstated when you factor in stealth cuts like higher insurance co-payments and the elimination of some retirement benefits. At the same time, debt service is on the rise, so consumers aren't able to consume as much as before.

I'd get all worked up about this if I didn't think it was necessary. Working people may be bearing the brunt of the rebalancing effort for now, but soon enough everyone will be feeling it. Having the pain felt most by the masses will get them to consume less, while getting more of them to recognize how the political establishment is working against them. Hopefully a future administration can figure out how to make sure more wealthy people feel their share of the pain.


If the job market heads south then it will hurt the housing and financial sectors the hardest. I've heard executives from more than one mortgage based company say that job losses are the big factor that leads to rising defaults. Most people can survive a squeeze by cutting back on consumption. They usually can't survive a prolonged job loss with their mortgages intact.

In my mind, the key to a successful transition will the the rebuilding of our manufacturing base, which has been largely dismantled after years of increased outsourcing and importing. After a long, steady decline, manufacturing jobs have recently picked up a little. When the dollar finally does start declining, and we begin unwinding the trade gap, we will hopefully be able to create enough manufacturing jobs to keep people occupied and make up for lob losses in other areas.

I continue watching weekly employment numbers to get an early indication of what's going on in the total job market. Ignoring the large blips from Katrina and the Puerto Rican shutdown, initial claims were trending down in 2005 and have began trending up in 2006. I'm expecting the trend to continue upwards, given the way things have been heading in housing and retail:

Thursday, July 20, 2006

The Housing Bubble and the Global Rebalancing Process

Mike Shedlock ran a letter from Florida realtor Mike Morgan in his blog today that does a great job of summing up much of what is wrong with the housing market these days. Please go check it out.


The bursting of the housing bubble is old news compared to the rebalancing process, but the two are inextricably intertwined. Excess foreign investment capital flowing into the mortgage market helped spawn the biggest housing bubble of all time. At the same time, the imagined wealth created by the housing bubble and the ease of cash out refinancing allowed consumers to live far beyond their means. As the rebalancing process unfolds, the damage will be especially great in the housing sector.


The first chart below adjusts 5-year annualized appreciation for inflation to show how much bigger this housing bubble has been on a national scale than any other housing bubble in recent history. (I did it a year and a half ago, so it doesn't include the last 6 quarters):


In inflation adjusted terms the nation has seen significant declines in housing values over multi-year periods, and certain areas have seen severe declines. The next chart is not adjusted for inflation, and if you fail to do that mentally you might be misled into thinking this bubble isn't as bad as the bubble of the late 1970s. Two main things it does demonstrate are how the bubble has been a national phenomenon and that we hit a final national peak of 9.44% for 5-year annualized appreciation. There is a very long way for prices to fall from here.


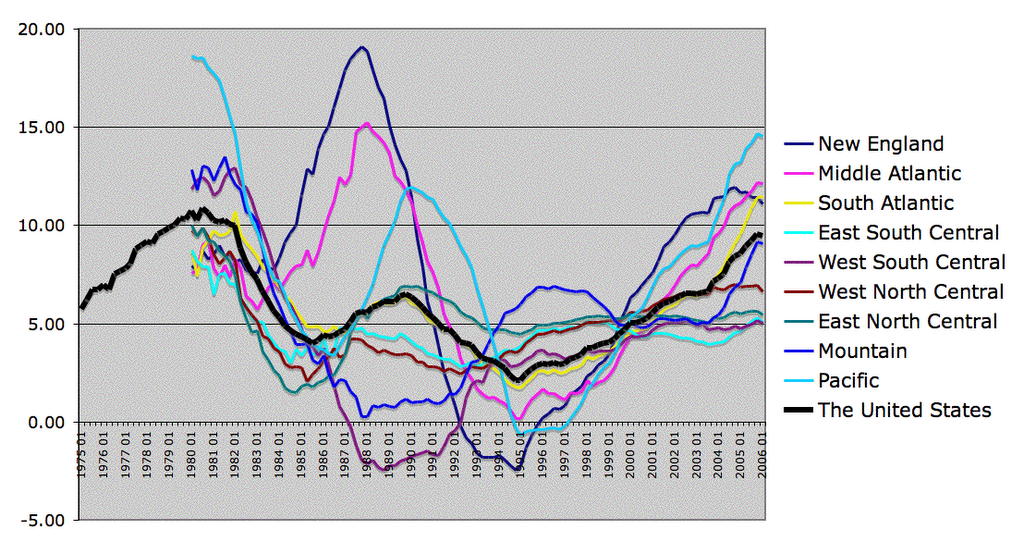
Because so much easy money was flowing into the housing sector, and because they are incredibly greedy, homebuilders went on a land acquisition and building binge that has been producing about 500,000 more new homes than the country has needed per year. Inventory is the biggest problem in the housing market, and we haven't come close to the inventory peak yet:


The severity of the housing bubble was obvious a year and a half ago, as was the unsustainability of the trade gap. All you had to do was look at the right data with a critical eye. The national press is gradually waking up to the reality of the housing bubble, although the news will get much worse. Global rebalancing isn't even on the radar of the major media yet, but I believe the overall impact will be even greater.

Wednesday, July 19, 2006

Inflation Accelerating and Interest Rates Rising

The inflation rate continues to accelerate:

CPI - U
3.3% in 2004
3.4% in 2005
4.3% from 6/05-6/06
4.7% for 2006 (last 6 months annualized)
5.1% for Q2 '06 (last 3 months annualized)

CPI - U - Core Rate (ignoring food and energy)
2.2% in 2004
2.2% in 2005
2.6% from 6/05-6/06
3.2% for 2006 (last 6 months annualized)
3.6% for Q2 '06 (last 3 months annualized)

The numbers seem to surprise economists almost every month, but the data is not surprising if one really understands the forces in play.

The Fed continues to raise interest rates in the name of inflation fighting based on an outdated principal. It is assumed that with a higher cost of borrowing, lenders will tighten up their lending standards and loan out less money because of lower profit margins and greater risk. If less money is created by bank lending then the money supply will contract and inflationary pressures will decrease.

This worked in the past, but the Fed has already raised short term rates from 1.00% to 5.25% and credit still appears to be expanding as fast as ever. M2 was up 4.8% from June 2005 to June 2006, and old components of M3 are growing much faster. Institutional Money Funds were up 12.1% Year-over-Year and Large Time Deposits were up 21.1% YoY in June. Surplus money continues to pile up in the accounts of corporations, foreign investors and wealthy individuals at a remarkable rate. This creates the potential for much greater inflation as dollar holders seek to spend, invest or trade them for goods or other currencies. Inflationary pressures have been building up in spite of the Fed's tightening.

If lenders and borrowers behaved rationally in the pursuit of sound long term financial goals then raising interest rates would accomplish the purpose of restricting credit. However, many borrowers are not behaving rationally and many lenders are pursuing short sighted goals at the expense of their long term health. Many consumers have created excessive debt burdens for themselves by over-consuming and/or borrowing too much when rates were low. As rates have risen their rising debt burdens have created great stress and disrupted their standards of living.

Most lenders are large publicly traded companies. Publicly traded companies are typically controlled by executives who are compensated based on short term objectives. Consequently, many large lenders seek to boost short term profits (often with questionable accounting methods) while creating hidden long term risks for shareholders. Lenders have been making high-risk loans and accounting for them with generous assumptions about default risk in order to book large profits. This is occurring to a large extent in the consumer credit and mortgage markets where an over-stimulated economy is temporarily suppressing delinquencies and defaults. When the economy starts slowing substantially, far greater losses will likely be realized and many lenders could be wiped out.

To a large degree, the risks associated with loans to consumers have been passed on to investors and institutions through securitizations. The consumer and homeowner loans created today can be quickly packaged and sold for a profit at prevailing market rates. When this is done it doesn't really matter what the Fed sets interest rates at, as long as there is enough demand for loans by borrowers and enough demand for securities by investors.

Another large source of credit expansion has come from lending to hedge funds. This doesn't get much attention, but I think it is even more significant than lending to consumers. When banks lend to hedge funds they profit from interest payments they collect, from the trading volumes they induce and other services they provide to hedge funds. The profits are large, but the systemic risks they create are huge. To illustrate:

At the beginning of 1998, Long Term Capital Management had $5 billion in assets and another $125 in borrowings. This leverage was multiplied further trough the derivatives markets to the point where they held $1.25 trillion notional value in swaps alone. By September 22nd of 1998, the value of LTCM's assets had fallen to about $600 million without much of a reduction in the size of the companies positions. LTCM couldn't liquidate their oversized positions without wiping out all of their asset value and bankers couldn't make margin calls without causing a collapse of the fund. Eventually the Fed stepped in and organized a $3.5 billion rescue package and many banks recognized hundreds of millions in losses.

The hedge fund world has grown considerably since 1998, and the revenue and profits provided to Wall Street banks has grown proportionally. Compensation at these banks is considerable and mostly based on short term performance. Little regard is given to the long term risks born by the banks and the economy as a whole as trillions of dollars are loaned out to hedge funds.

Hiking interest rates does little to discourage lending to consumers or hedge funds because many of these lenders no longer care about the long term risks. If the Fed wants to tighten up lending standards it will need to do it through the active enforcement of reserve requirements. Traditionally, reserve requirements limited a bank's ability to create new money. Of course banks don't like reserve requirements because they cut into profit margins and limit the profit and revenue growth of the entire financial sector. The Fed is a private sector institution, composed of bankers and serving bankers. The lessons of banking stability from the great depression have been forgotten, and the Fed has gone down the slippery slope of relaxing official reserve requirements. Indeed, the use of securitizations now renders reserve requirements almost meaningless when it comes to limits on creating new credit.

The real effects of rising interest rates are to temporarily support the dollar and to squeeze middle-class borrowers. Both of these effects serve the interests of the bankers that control the Fed. If the dollar falls too fast, then they lose out on currency based derivatives bets. If consumers enjoy a higher standard of living then wealthy bankers enjoy a smaller piece of the economic pie. For those reasons we can expect the Fed to continue tightening as long as they can get away with it.


And a final note:
Many observers believe that the Government intentionally understates CPI for political reasons. Besides making the economic policies of the administration look more effective, understating CPI would also save the government large sums of money in the form of reduced Social Security payments. Without going into too much detail, I believe that methodology changes are pretty consistent in lowering CPI estimates. A quick example that is easy to track is the way weightings were readjusted at the beginning of 2006. Certain items, like gasoline, were given less significance in the CPI, while others, like computers, were given more weight.

If these changes had not been made, CPI - U would have been 4.5% over the past 12 months instead of the official 4.3%. Since both measures include the same weightings for July-December of 2005, the real difference is in the last 6 months, and we might estimate that annualized CPI - U for the last 6 months would have been 5.1% instead of the official 4.7%.

There is always a rationale for methodology changes, but in this case the change seems to counter reason. While consumers may be purchasing a little bit less gas these days, gasoline has gone up significantly as a percentage of most people's budgets. The BLS, however, decided to lower the weighting of gasoline from 4.418% to 4.148%. With gasoline prices up 34.1% according to the CPI data, lowering the weighting of gas has had the effect of understating CPI growth over the last 6 months.

Tuesday, July 18, 2006

Treasury International Capital Flows and a Fed Conspiracy Theory

When the treasury finally gets around to publishing TIC data, it is a month and a half old. It doesn't tell you what's been happening lately, but the trends can be clear and it helps explain what was happening a couple of months ago.

May was notable as the month the stock market started going down the tubes. It was also a month where Foreign Official holdings of treasuries fell by $16.6 billion (counting T-Bills) and official net purchases of domestic securities was negative for only the second time in almost 3 years of data (-$3 billion w/T-bills, -$1.4 billion w/o). This was an acceleration of a larger trend for official accounts toward selling off US treasuries and slowing long term asset accumulation. At the same time, the trend toward Americans investing more in foreign markets has accelerated:


To me this is an indication that the smart money has been fleeing out of US assets and especially US Treasuries.

Japan (who was a huge buyer back in early 2004) continued to reduce holdings in May. They are down to $637.9 billion in May from $672.8 billion in September, so who has been buying to pick up the slack? China ($3.9 billion), the United Kingdom ($8.9 billion), Oil Exporters ($3.7 billion), Canada ($4.6 billion) and Brazil ($2.3 billion) were the biggest purchasers of treasuries during May. China is working the trade gap and building up foreign currency reserves faster than any other nation. Canada, Brazil and the Oil Exporters are rich in resources and also big exporters to the US. But what about the UK, where treasury holdings have almost tripled over the past 11 months, from $58.8 billion to $174.7 billion???

I've seen a conspiracy theory floated around the web stating that the Fed has been buying up treasuries through secret hedge fund operations in the Caribbean. I don't know if the Fed is directly behind recent demand, but I'm fairly confident that hedge funds are involved. The Channel Islands or Isle of Man are included in the UK data and many hedge funds are registered there. Some of these funds have likely been borrowing many billions of dollars into existence and providing enough demand to keep treasury prices from collapsing. In the TIC data "private" investors boosted holdings, and that statistic gets trumpeted in the financial media, but most of this is probably newly created money that is being invested by hedge funds registered overseas.

Even with credit expansion in the consumer and housing arenas slowing, money supply growth continues at an amazing rate. Sure, M2 isn't growing very quickly but that's the money average Americans have in their savings and checking accounts. As we know, the average American has been feeling the squeeze of late. M3 growth, however, had been in the double digits. The Fed stopped counting M3, just as treasury holdings in foreign official accounts began shrinking and purchase in the UK and Caribbean banking centers jumped by a combined $24.1 billion. Is it just a coincidence that the Fed discontinued M3 when credit expansion via hedge funds was taking off?

Looking forward to June and July data, H.4.1 data published weekly suggests that official accounts went back into positive territory in June (as the markets stabilized) but flows turned negative again for the first part of July (and we know what's happened to the markets the last couple of weeks).


Tying this all back to the issue of rebalancing, it appears that the process is occurring from both sides at the same time. Just as consumers are hitting a wall, foreigners are slowing their purchases of US securities. As rates continue upward and the stock market continues downward the first obvious effects of rebalancing are becoming clear. The next stage will likely be for the US consumer economy to start to contract much more visibly and for inflation to rise even faster.

Newly created and foreign money is piling up in institutional accounts and earning a now-respectable 5-6% and this provides additional domestic demand for treasuries. So hedge funds appear to be funding the US treasury both directly and indirectly (by credit expansion). All this money growth is of course inflationary and inflation numbers continue to surprise the experts to the upside. Perhaps that's because the experts don't understand the rebalancing process.

Is there an easy way out of this mess? No, but the sooner we recognize the process underway and adjust appropriately the less the damage will become. We need to bring down the value of the dollar dramatically. We need to lower interest rates and tighten up credit standards. We need to brace ourselves for a chain reaction of defaults in the financial markets. We need to start investing in education, new technologies and infrastructure to keep the economy functioning. We need to quit pissing away money in Iraq. If we don't get a good start while we still have a functioning economy it will be much more difficult after the system crashes under its own weight.

Monday, July 17, 2006

An Analogy

Back in January of 2005 the following was posted to a message board on the Motley Fool:

Why is it, exactly, that a trade deficit is bad? What is it, exactly, that is bad about China, Japan, the pope, the Duke of Edinborough, or the man on the moon buying US assets, or government debt?

I responded with an analogy:

"You used to own your home, free and clear, and even had some investment income (net foreign investment surplus). You had a decent income (GDP) and were living the good life.

Then you began living beyond your means, buying high priced toys that you couldn't really afford (trade gap) and taking expensive vacations (government deficit spending on military misadventures). You started drawing down your retirement savings (raiding the SS trust fund). You took out a mortgage on your house (foreign investment in US assets).

Pretty soon, your disposable income was starting to feel the pinch because instead of investment income coming in, you had interest payments going out. Nevertheless, you didn't want to decrease your standard of living, so you increased your rate of borrowing. You refinanced the mortgage with an ARM (selling shorter term treasuries at suppressed rates) to pay for a vacation in the middle east, and took out a home equity loan and spent it on more toys (selling mortgage backed securities to foreigners). Then you started maxing out your credit cards (selling high-yield corporate bonds to foreigners).

(This is where we stand right now. Continue the analogy forward, to see what happens next.)

As your total debt grew, your disposable income shrank. It became much harder to find people willing to loan you money (dollar crashes, trade gap shrinks). Your standard of living dropped like a rock. No more toys, no more vacations, and all your income went to paying for essentials and interest payments. Then rates went up on your ARM (nobody buying treasuries), and you started missing payments on the home equity loans (Fannie Mae collapses). You declared bankruptcy to erase the credit card debt (corporate bankruptcies) finally you reached the point where nobody was willing to lend you more cash (deflationary spiral).

You lost your car and house (foreign ownership of everything worth owning), and the stress broke up your marriage (civil unrest). You lost your job (depression), and are left living under a bridge and waiting in soup lines for your daily meal."

Sunday, July 16, 2006

The Great American Ponzi Scheme

In a Ponzi scheme money from new investors is used to pay off earlier investors. In many ways, the American economy resembles a Ponzi scheme. While there are many productive American asset classes capable of generating positive returns on their own, the economy has grown increasingly dependent on the creation of new debt as a way of paying debt service on existing debts. The system really hasn't been tested yet, but we may have already reached a point where Ponzi finance is required to postpone an economic meltdown.


Trade Gap and Gross External Debt

The following two charts show the dramatic expansion of the Trade Gap and Gross External Debt to foreigners.


As the size of our debt to foreigners has increased, interest payments on that debt have also increased. These payments would have been a very large drain on our economy if we hadn't been able to continue borrowing more new capital each year. Thanks to Ponzi finance, the nation has been able to pay existing debt service by borrowing additional funds from new foreign investors. The system is already being tested as foreigners have been slowing their pace of new investment into the United States. The scope of this test will likely accelerate and the results of this test will likely involve a simultaneous decline in the value of the dollar, the amount of US consumption, overall economic activity, and the price of US assets. My expectation is that the US economy will not handle this test well.

Federal Deficit and Debt
As of 6/30/2006, the Federal Debt was $8.42 trillion and growing rapidly. So far the Federal Government has run up a deficit of $206 billion, but that lowball estimate treats money looted from the Social Security and Medicare trust funds as revenues. Counting that money, the national debt has grown by almost $500 billion over the first 9 months of Fiscal 2006. Counting accrued benefits to veterans and civil service workers and many other promises-the-government-won't-be-able-to-keep, the true yearly deficit is well over $1 trillion.

Interest payments on the national debt will total over $400 billion this year, up from about $350 billion last year. Thanks to Ponzi finance the treasury has been able to pay off old investors with new bond sales and accounting fraud. As the system gets tested, we can expect yields on US treasuries to rise (as they've been doing for the past 3 years) until the government finally has to default on its debt in one form or another.

Social Security
Social security was designed to function like a Ponzi scheme where funds collected from the current workforce were used to make payments to current retirees. Over time it was supposed to build up enough of a trust fund that it would shed its Ponzi nature. Because of demographics, the large baby boom generation generated revenues for the system and kept it solvent. Within the next few years, enough baby-boomers will begin collecting benefits that the Ponzi nature of the system will be severely tested. However, we might not even get to the point where this solvency of the system gets tested. Roughly $3.6 trillion has been taken from the Social Security and Medicare trust funds and has already been spent by Congress and the President. The solvency of the Federal Government should fail its test well before the Social Security and Medicare trust funds run out of money.

The Stock Market and Other Pension Plans
Public and Private pension plans across the nation face similar problems to the Social Security system. Boomers and their employers stuffed money into these retirement plans at a time where demand for investment options was high and prices were inflated. When plans have to sell off assets to meet the retirement needs of boomers, prices can be expected to be residing at relatively low levels.

On average, public pension plans are about 15% underfunded based on current asset prices. As the reality of Ponzi finance takes hold, I expect plan managers will come to realize that conditions are much worse than they've been expecting. For public plans, like the massive state employee and teacher plans, the Ponzi principle will be stretched even further as new employees are called on for greater contributions in order to meet the promises made to retirees. Meanwhile many corporations are looking for ways to avoid responsibility for servicing their own plans, often by transferring the burden to the government through the Pension Benefit Guarantee Corporation. If you read the news with a critical eye, you'll see that pension plans across the nation are already failing their test and being exposed as Ponzi schemes.

The Tech Bubble
The tech bubble was an example of Ponzi finance that already failed for investors. It was largely fueled by hordes of investors and mutual funds piling into the same groups of money-losing tech stocks. While the scheme was working, capital from new stock and bond offerings was keeping the companies afloat and fund managers were collecting hefty fees based on inflated asset values. Meanwhile profitable companies were temporary beneficiaries of huge capital flows into the sector. As the flow of new capital dried up, many companies began to fail and profits shrank for others. As investors tried to pull money out of these stocks they learned the lessons most Ponzi investors eventually learn: that the gains from underlying assets are an illusion and that only the quickest investors to exit will be the only ones to get their funds back.

The Hedge Fund World
Many hedge funds are like high tech mutual funds on steroids. They employ highly leveraged strategies where they borrow vast sums and pile the money into a given asset. Their growth over the past few years has been tremendous and this growth has guaranteed exceptional returns on paper. As they've gobbled up large positions in small cap stocks and thinly-traded (or not traded) derivative instruments they guaranteed their own short term success. The gains are mostly just on paper, yet this allows them to extract huge fees from investors. Returns have been leveling off for the hedge fund world as of late. Like any good Ponzi scheme, a falloff in returns will lead to a loss of investor confidence, and a rush of redemptions will then lead to a failure of the scheme.

Derivatives Markets and Underwriters
Big Wall St. underwriting institutions like JP Morgan and Citigroup have made huge profits by purchasing risk on the derivatives markets. They've stabilized the bond and other markets so far by selling derivative insurance products. The more they derivatives the sell, the more other financial institutions are willing to buy and hold mortgage, treasury and other debt. This keeps yields down, ensuring that JPM and C don't lose on their bets.

As debt levels have risen, the big underwriters have had to taken on escalating levels of derivative exposure to keep rates stable. Perhaps the bond markets can avoid a meltdown that would in turn wipe out many large derivatives players. Personally I think that US treasuries are heading for a massive default, and this will expose the Ponzi nature of the derivatives markets.

Consumer Credit and the Mortgage Market
A good portion of the rise in gross external debt has been a result of consumers piling on more and more debt. Financial Obligations Ratios have hit a record high as a large number of consumers and homeowners get pushed to the limit. Without really understanding the dynamics of it all, many consumers have been running their own Ponzi schemes with mortgage investors as the eventual victims. Many consumers lived beyond their means by running up large credit card balances and other forms of consumer debt. Some of them avoided default by "consolidating" this debt into larger mortgages. These mortgages got sold off to investors in a process of easy credit that drove up demand for homes. However, many consumers and homeowners are hitting the wall. Consumer spending has leveled off and legions of over extended borrowers are being forced to put their homes on the market. Home prices have stagnated, eliminating cash-out refinancing as an Ponzi finance option for a growing group of debtors. When the ability to borrow more reaches an end, a Ponzi scheme collapses.

Summary
Gross External Debt and Trade Gap are good indications of a grand Ponzi schemes that have spawned many other schemes within. Foreign investment pouring into the economy has gone into treasury debt, or mortgages, or corporate bonds, or the stock market or real estate, or any number of other tangible assets. Foreign investment also has created large numbers of jobs that can disappear almost as quickly as foreign interest in American Ponzi investment schemes. I think that all of the individual Ponzi schemes are doomed to fail under their own weight, but if foreign investment dries up substantially, the other schemes should fail more more quickly.

One thing the US has going for it is that it has the potential to rapidly devalue its currency and therefore the significance of its dollar denominated debts. The debts levels, however, are so high that the extent of devaluation would need to be substantial.

The other thing going for the US is that it still has a large quantity of productive assets that can generate a portion of the returns needed to service the growing debt burden. The longer the Ponzi finance schemes continue, the harder it will be for debts to be serviced, if indeed they ever can be without further extension of the Ponzi model.

The period from 1987 to 1991 was the last time we saw a substantial decline in the size of the trade gap. That period also saw a substantial decline in the value of the dollar and a painful recession. Of course the United States was still a creditor nation back then and the yearly trade gap was much smaller. This time it will be much more difficult to reduce the size of the trade gap and the economic pain will probably be far greater.

Saturday, July 15, 2006

Trade Gap by Nation

(I posted most of this on the Motley Fool message boards 2 months ago, which is why the data is for Q1, and not through May.)

The unadjusted cumulative trade balance for Q1 was -$190,240,800,000, putting us on a pace for around $760 Billion in officially recognized wealth transfer to the rest of the world.

Eventually, the flow of wealth out of the US has to come to slow dramatically (otherwise we'd totally run out of assets and there wouldn't be anything left to sell to foreign investors).

A question I've been exploring for a long time is: What will the reduction in the trade gap will look like?

Taking a look at the US trade balance with individual countries is informative:

Q1 '06 Rank-Country-(Q1 '05 Rank)-Q1 '06 Trade Balance-Characteritic
1 China (1) -$47,321,000,000 Cheap labor and an artificially weak currency
2 Canada (3) -$21,529,000,000 Oil, resources and proximity
3 Japan (2) -$21,147,000,000 Technology and a suppressed currency
4 Mexico (5) -$14,779,000,000 Oil, proximity and cheap labor
5 Germany (4) -$12,101,100,000 Technology
6 Venezuela (6) -$7,296,700,000 Oil and a pegged currency
7 Nigeria (8) -$6,419,000,000 Oil
8 Saudi Arabia (12) -$5,518,200,000 Oil
9 Malaysia (7) -$5,501,500,000 Oil and cheap labor
10 Ireland (11) -$4,801,200,000 Technology and cheap labor
11 Italy (10) -$4,614,200,000 Technology
12 Taiwan (13) -$3,795,000,000 Technology
13 Thailand (15) -$3,466,200,000 Cheap labor
14 South Korea (9) -$3,262,200,000 Technology
15 India (16) -$3,143,500,000 Technology and cheap labor
16 Russia (14) -$2,893,000,000 Oil and Technology
17 France (18) -$2,768,300,000 Technology
18 Sweden (17) -$2,543,600,000 Technology
19 Algeria (24) -$2,541,400,000 Oil
20 Indonesia (21) -$2,459,000,000 Oil, resources and cheap labor
21 Angola (26) -$2,210,600,000 Oil
22 Iraq (23) -$2,018,100,000 Oil
23 Israel (22) -$1,997,500 Technology
24 Brazil (19) $1,939,800,000 Resources
25 Trinidad and Tobago (25) Oil
26 Vietnam (27) Cheap labor
27 United Kingdom (20) Technology
28 Norway (28) Oil and Technology
29 Austria (30) Cheap labor and Technology
30 Equador (29) -$1,089.400,000 Oil

A supply of cheap labor is probably the biggest factor in running a big trade surplus with the US, as long as there is adequate infrastructure and enough trained workers to provide for efficient production. After that comes Oil and other resources, where good infrastructure and domestic tranquility don't seem to matter much. Many technologically advanced nations, including Japan, Germany, Italy, South Korea, Taiwan, France and Sweden run large trade surpluses with the US, probably because the US Dollar has been propped up so high for so long.

Presumably the huge US trade gap with China could be (and will have to be) reduced by reducing US wages to result in reduced consumption and living standards. Judging by the last two monthly declines in the trade gap, and the ongoing middle-class squeeze, this process has probably already begun. China continues to effectively peg its currency to the dollar. I believe China will eventually have to cut the dollar loose as there has been a speculative bubble forming in Chinese stocks recently.

Presumably the trade gap with Japan, Germany and other technologically advanced nations could be corrected with a large decline in the value of the dollar. The Yen and Euro have risen about 7% against the dollar in the last month, and would probably have risen much more if not for the effective peg from China. Europe has been buying up US technology and companies at an alarming rate. The US can't afford to lose its technological edge on the rest of the world if it hopes to reverse the trade gap without a horrible decline in earning capacity and living standards.

Presumably the trade gap with oil exporting nations could be reduced by using much less oil. Energy prices have been rising rapidly, and that may be starting to have an impact on consumption habits, especially in terms of home heating. Oil prices have a lot further upwards to go, at least in dollar terms. Alternate and renewable energy sources will become more practical and those will help on the supply side, while a continuing squeeze of consumers and an economic slowdown will likely result in a decline on the demand side.


The total Q1 trade gap grew from $166 Billion in 2005 to $190 Billion in 2006. It is interesting to note which countries lost ground relative to each other: Japan, Germany, Malaysia, Italy, South Korea, Russia, Sweden, Israel, Brazil, United Kingdom & Equador all lowered their ranking. Meanwhile, those gaining ground included: Canada, Mexico, Nigeria, Saudi Arabia, Algeria, & Indonesia. Rising Oil prices were obviously a very big part of that. In absolute terms, China's trade surplus with the US increased by $5.3 Billion, while South Korea's declined by $1.1 Billion. The Won has been strengthening longer than the Euro has, and much longer than the Yen has, so I suspect the change in currency valuations is already having a significant impact on South Korean exports.

There are a few countries that actually run significant trade deficits with the US:

226 Netherlands +$3,275,800,000
225 United Arab Emirates +$2,872,800,000
224 Australia +$2,369,200,000
223 Hong Kong +$2,047,100,000
222 Singapore+ $1,305,100,000
221 Belgium +$1,095,700,000
220 Panama +$517,700,000

The U.A.E. exports most of its oil to Japan, South Korea, India & Thailand, rather than the US). The others tend to prosperous, centers of trade, rather than exporters. Perhaps the best way to reduce the trade gap is really to increase the prosperity of all nations, so that they can import more from the US. This, however, would require a complete reversal of US foreign policy, which has been to promote violence, destruction and poverty throughout the world in order to claim a greater percentage of the world's resources.

Economic balances are shifting towards a point where the US will no longer be able to plunder the resources of impoverished nations. The transition period will probably be very painful for most Americans. Hopefully this will give rise to a new political way of thinking, where renewable energy, recycled resources and global economic prosperity become the focus for American industry and political leadership.

Trade Data

Currency Data

Friday, July 14, 2006

Foreign Investment and the Trade Gap

Excessive consumption in the US is one half of the trade gap problem. The other half is excessive foreign investment. US assets are not a good long term bet for most foreigners, but as long as sufficient demand persists the dollar can stay strong and the trade gap can continue. Much of the demand for US assets comes from foreign central banks, but that demand has been drying up. Not surprisingly, the US financial markets are struggling from a lack of foreign support.


In 2004, the Bank of Japan went on a big US treasury buying binge as part of a campaign to weaken the Yen. However, Treasury data shows that Japanese monetary authorities and investors have begun selling off US treasuries since last September. Total foreign holdings of treasuries declined in April, marking the start of substantial declines in most US asset classes. Indeed, TIC data shows that purchases that for foreign demand for all major forms of US assets declined in April.


The fed publishes "Marketable securities held in custody for foreign accounts" every Thursday afternoon:

Over the past 52 weeks (7/05-7/06),
U.S. Treasury holdings were up $20.564 billion
Federal Agency holdings were up $169.367 billion

In the prior 52 weeks (7/04-7/05),
U.S. Treasury holdings were up $95.679 billion
Federal Agency holdings were up $112.937 billion

In the 52 weeks prior to that (7/03-7/04),
U.S. Treasury holdings were up $239.555 billion
Federal Agency holdings were up $53.126 billion


The following chart shows the decline of treasury purchases and the rise in agency purchases over the past 10 quarters:


Foreign central banks have lost interest in US treasuries and shifted their appetite to Agency debt (Fannie Mae's and Freddie Mac's mortgage backed securities). In my opinion they are doing this because they expect that US treasuries will eventually be worthless and would prefer to invest in something that is actually backed by hard assets.

Agency debt has Fannie's and Freddie's guarantees that payments will be made, but those guarantees are only as good as the cash position of the two gigantic GSEs. The leverage on trillions of dollars worth of mortgage backed securities could easily wipe out the GSEs if housing prices return to trend and enough borrowers default.


With data showing foreign investment is in decline, the biggest question becomes one of WHO is picking up the slack and buying new treasury issues and other types of US assets? Of course I have my theories, but those will be the topics of future blog entries.

Thursday, July 13, 2006

The Dollar and the Trade Gap

The biggest factor behind global trade imbalances is the overvalued dollar. Because it is so severely overvalued, foreign produced goods have a huge competitive advantage over domestically produced goods. Unwinding the trade gap will require a substantial decline in the value of the dollar in order to make US production more competitive.

The US dollar became overvalued for four main reasons, in my opinion:
1. Asian countries manipulated their currencies to boost the value of the dollar.
2. European countries kept interest rates low to make their currency less attractive to currency speculators.
3. The United States has pursued strong dollar policies to temporarily boost the standard of living of voters.
4. Foreign investors have a misplaced sense of confidence in US assets.

China maintained a peg of the RMB to the Dollar for many years. That peg was officially broken on July 22nd, 2005, but the following chart shows clearly that the dollar really hasn't been allowed to float freely against the RMB:


The fluctuation in the RMB/Dollar rate is nothing like the fluctuation of the dollar against other currencies. China's central bank most likely keeps a tight control on the fluctuation of the dollar, allowing it to decline at a snail's pace so that Chinese exporters don't have to endure much economic uncertainty.

Japan's economy hasn't been growing very fast since the Japanese stock and real estate bubbles burst in the early 1990s. Japan kept interest rates at 0% for years, which makes it attractive to currency speculators to borrow Yen at low rates, purchase dollars, then leave those dollars in interest earning accounts. While most other central banks have been raising rates for a year or more, the Bank of Japan has kept rates at 0%. Consequently the Yen has been one of the weakest currencies on over the past 12 months. With inflation picking up in Japan, there is much specualtion that Japan will start raising interest rates tomorrow, which would hopefully allow the Yen to strengthen.

South Korea intervened for a long time to keep their currency weak, but over the past year they've let the Won strengthen. Part of that may be politically motivated, as a way of boosting the standard of living of Korean consumers.

Canada's currency has been strong as the country is rich in commodities. In the inflationary environment of competitive devaluation (from everyone except the US), commodity prices have soared and the net worth of the nation of Canada has appreciated.

European currencies have strengthened considerably against the dollar over the past 3 months and 3 years, even though there was a long period where little change occurred. While European central banks would generally prefer weaker currencies, they then to be philosophically against overt manipulation in the currency markets, unlike their Asian counterparts.

The US Federal Reserve has led the charge in raising interest rates. The official reason given for continued rate hikes is to fight inflation, but I don't believe that works anymore in a banking sector that is guided by short term profit motives or with a financial system that can repackage and redistribute wealth to an endless array of unsuspecting bag-holders. Instead, I think rising interest rates are more about supporting the value of the dollar while also squeezing interest rate sensitive consumers to make sure they absorb most of the pain in the rebalancing process.

As the US consumer struggles and becomes less important to Chinese exporters, I'd expect China to focus more on exporting to Europe. If the dollar was allowed to simply fall against the Yen and RMB, then the long-term trend would be towards a stronger Euro against the dollar, but a weaker Euro against the Yen and RMB. However, I don't think Japan and China would want to let than happen, so the Euro likely will continue to strengthen against the dollar as well as Asian currencies.


The US Markets have long been a stable and reliable place for foreign investors to put their capital. Because of this many foreigners still have misplaced faith in the US financial system. The US government is bound for bankruptcy and while nobody in the media seems to recognize that yet, foreigners have begun shying away from treasury bonds. The housing market is in a dangerous bubble state, so Agency debt is risky as well. The most popular sector for foreign investment of late has been corporate bonds, which are arguably safer than US equities because bankrupt firms will eventually be transfered into the hands of bondholders. It will take a long time for investors to fully adjust to the sad state of the American economy, but reality should eventually be reflected in both the markets for US assets and the value of the dollar.

Currency speculators are a major factor in the short term pricing of the dollar. They played a large role in the decline of Asian currencies in 1997 and in Argentina more recently. By propping up the dollar with higher interest rates the Fed is playing with fire. The short term flows into the dollar can eventually reverse and cause a much greater dollar crisis down the road.


For the above reasons and more, I expect the dollar to decline substantially over the next several years. Gradually this should reduce the ability of Americans to consume while also improving the competitiveness of American exports. If policy can be developed with the harsh realities in mind, then the process doesn't need to be very painful. However, based on the recent actions of our political and financial leaders, the potential for a painful economic crisis is very high.

Wednesday, July 12, 2006

The monthly trade gap data came out today, and showed some hopeful signs. The revisions continued to be downward and the May number was below analyst estimates. Both are often indications of a trend reversal. Also, exports grew at a good rate, which is the best route toward rebalancing.

On the alarming side, the Balance of Payments continued to expand over the headline trade gap number, coming in over $70 Billion for the month. The total accumulated debt burden is becoming an substantial problem on top of the Goods and Services gap. The May Balance of Payments number was $70.084 billion, or $6.249 billion more than Goods and Services, compared to $5.444 billion more in May of 2005. The debts we are piling up now will be a permanent burden on the American standard of living.


The following chart shows the Goods & Services trade gap starting to trend down (hopefully), with imports showing signs of stalling:


The next chart shows the year-over-year percentage change in trade gap data:


International trade has been a huge growth engine for the economy, both in terms of imports and exports. Unfortunately, much of our imports have been purely consumption based and haven't done much to improve the long-term strength of our economy. Meanwhile, much of our exports have been in the form of capital equipment and construction materials, strengthening our competitors and making the job of rebalancing all the more difficult.

2005 Exports
Capital Goods: $362.686 billion
Consumer Goods: $115.715 billion
Automotive: $98.578 billion

2005 Imports
Capital Goods: $379.227 billion
Consumer Goods: $407.168 billion
Automotive: $239.512 billion


Increasing the size of our exports of consumer goods will be an indication that the rebalancing process is preceding in a positive manner. Unfortunately, consumer goods are the area of exports that is growing most slowly and auto exports actually appear to be contracting. Meanwhile, imports of consumer goods and autos have been on the decline this year, suggesting that the trade gap is unraveling as a result of overburdened consumers, rather than as a result of a strengthening global economy.

Tuesday, July 11, 2006

State of the Consumer

Simply stated, the trade gap exists because the United States has been importing and consuming more than it has been exporting. A large part of that has been due to consumers taking on greater debt loads to increase their consumption. Foreign investors and domestic lenders have been willing to finance this by extending an large amounts of credit to consumers and homeowners. However, a recent slowdown in the expansion of consumer and mortgage credit could signal an end to the expansion of the trade gap. Whether a decline in consumer spending comes from tightening credit or from the loss of purchasing power, the shift could signal an important change in economic conditions.

Debt Service and Financial Obligagions Ratios published by the Fed show that consumers are getting squeezed tighter each quarter as a greater percentage of in come goes toward paying off debt. Both the Debt Service Ratio and the Financial Obligations Ratio set new record highs in Q1 2006. For many borrowers the idea of taking on more debt has become undesirable. For others, taking on additional debt may be the only way to temporarily avoid bankruptcy. Either way, many consumers are reaching an important transition point.

The period from 1998 to 2001 saw an especially large rise in
Consumer Credit, while 2001 to 2005 saw a dramatic increase in Real Estate lending. Both sources of credit expansion helped fuel the trade gap, but both appear to be drying up now. Consumer credit is only up 2.2% from May 2005 to May 2006, not nearly enough to keep up with inflation and population growth. Meanwhile, data from the Mortgage Brokers Association shows applications activity is down substantially from last year's peak levels (quarterly averages charted below):


Money Supply data shows a similar decline in the willingness or ability of consumers to spend.

M1, the money people supposedly intend to spend, is only up 1.7% from May to May (+$23.2 billion). All of that gain is the result of an increase in currency floating around (+$34.8 billion) while demand and other checkable deposits are down substantially over the last 12 months.

M2, the small sums of money people supposedly are saving, is up 4.7% for the last 12 months. Within that savings accounts are only up 2.4%, again not enough to keep up with inflation and population growth. Meanwhile, Retail Money funds are up 4.3%, Institutional Money Funds are up 11.9%, Small Time Deposits are up 18.7%, and Large Time Deposits are up 21.0% YoY.

The pattern seems to be that average consumers are getting squeezed while wealthy individuals and institutions are rolling in new cash. This squeeze is likely putting a damper on the trade gap, holding it to the low $60 billions per month. Continued financial stress caused by resetting adjustable rate mortgages and other debt related burdens may reduce the size of the trade gap, but not in a way that is beneficial to most Americans.

Enough rope (credit) is still being provided to almost any consumers who seek to hang themselves. It would have been much better to just keep credit tighter to begin with to avoid creating such extreme imbalances. I believe the least painful way out of this current problem is still to tighten up on lending standards while keeping interest rates low. Of course the financial sector wouldn't think highly of that solution.