Economic Rebalancing

The global economy is horribly out of balance, with the United States going deeper into debt each year as a result of a huge trade gap. This blog describes the process of global economic rebalancing. If you have any comments or questions about the posts here, please don't hesitate to use the comments section.

Thursday, August 31, 2006

Economic Report Summaries

A lot of economic reports came out today, underscoring the deteriorating state of the US economy.

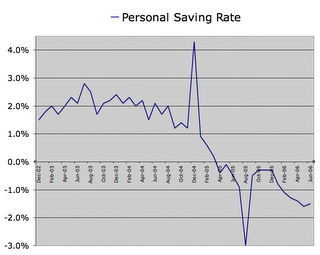
The Personal Income and Spending report showed that spending continued to grow faster than income, with a negative net savings of $83.5 billion for the month of July, or -0.9% of disposable personal income. That's a record, but the data doesn't even include mortgage interest payments. Mortgage debt service had risen from 9.04% of DPI in Q1 2000 to 10.49% of DPI in Q1 2005 to 11.41% of DPI in Q1 2006. That percentage is growing rapidly because this is the year of sharp adjustable rate resets.

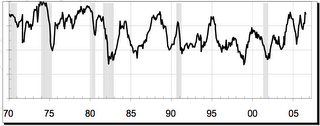
The Chicago Purchasing Managers' Index came out as well, showing a declining trend in employment and a rising trend in prices paid. The Fed can fight one or the other, but not both. Prices Paid are heading up toward levels not seen since the 70s:
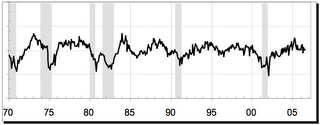
Employment appears ready to roll over and play dead:


The Kansas City Fed reported similar trends.

Initial Unemployment Claims remain subdued for now, although insured unemployment continues to rise. Tomorrow's employment numbers could reflect this.

Finally, the Fed's H.4.1 came out today, showing a big surge in Reserve Credit ($13 billion) just in time to goose the markets for this week's auctions and the close of the month. Meanwhile, official accounts shed a couple billion in treasuries, but with the big 2 and 5 year auctions this week they probably added a bunch at today's settlement that will show up next week.

Wednesday, August 30, 2006

The Importance of the FX Carry Trade

Trade gap dollars come back to the US economy via several routes:

Foreign central banks can acquire US assets, including treasuries, agency debt, corporate debt and equities. They can get these dollars when they intervene in the foreign currency markets with dollar purchases or when foreign exporters convert dollars to their local currencies. Either way, the foreign central banks bolster their balance sheets and keep the dollar propped up by creating demand for dollars.

Foreign corporations can also buy US assets, doing their own part in maintaining the strong dollar and keeping up demand for their products. When foreign companies build factories on American soil they also improve their competitive position relative to US companies.

Private foreign investors also buy US assets. While foreign investment in US stock markets has declined since the dot-com bubble, the acquisition of entire companies may be picking up.

The three routes mentioned above all result in wealth transfer from the US to the rest of the world, but they seem to be declining in popularity as the US becomes a poor credit risk. Over the past couple years the trade gap has grown with the dollar remaining strong due to a dangerous and unsustainable function of the financial markets.

When the Federal Reserve started raising short term rates substantially it created a new avenue for trade gap dollars to flow back into the country via the FX carry trade. Hedge funds and other currency speculators could borrow foreign currencies at low rates, purchase dollars on the open market and then invest those dollars at higher US rates.

This form of the carry trade works as long as the dollar doesn't decline rapidly against the foreign currency where debt is incurred. The more people playing this trade the better it works because surplus dollars are soaked up out of the forex markets and put into the US investment pool. The dollar stays strong and the value of US assets get a boost as well. Of course the unwinding of these trades could be rapid and devastating if things get out of hand.

An unfortunate side effect is that the tremendous amount of money being borrowed into existence is inflation and foreign central banks around the world are boosting rates to combat it. The fed has to continue raising rates relative to other central banks or the forex carry trade could be forcibly unwound. Meanwhile short term rate differential must be maintained via rising fed funds rates in order to soak up dollars via the FX carry trade. At the same time, bond yields must be kept down so that current carry traders aren't unwound by declining bond values. Finally, the dollar must also stay strong to keep carry traders above water.

With foreign official purchases reversing to sales, the treasury may now be meeting its demand for funds thanks to hedge funds employing the FX carry trade. Fund managers are collecting their management fees based on their paper profits for now, but there is no way they'll be able to get out cleanly when the system eventually breaks down. I suspect (Goldman Sachs CEO turned Treasury Sectratary) Paulson is scrambling to buy time for insiders to get out of unstable positions and secure their 2006 Christmas bonus checks before it all comes crashing down.

Wednesday, August 23, 2006

Please take a look at today's entry in the Corrupitalism Blog.
Please spread the word if you think others might benefit from reading it.
Please comment if you have suggestions on how to improve it.

I occasionally add an item to that blog that is more political in nature and intended as a long lasting reference iterm that I can go back to and edit.

I'll probably be posting less freqently over the next week, so take a look at the Table of Contents If you missed earlier posts or don't have anything better to do.

Tuesday, August 22, 2006

The Economics Underground

The field of economics is corrupted by large financial institutions, government agencies and trade organizations. Most economists employed in by these bodies have an institutional bias they have to promote in their writings. The government has to paint a positive picture of the economy and lend credibility to policies that favor whichever party is in power at the time. Trade organizations like the National Association of Home Builders and the National Association of Realtors want to spin economic news in a way that creates more business for their members. Wall Street economists, of course, are the worst of all, consistently urging the public to buy when their firms want to sell and to sell when their firms want to buy.

The polite explanation for the inaccuracy of economic forecasts is that economics is an inexact science, but I believe the truth is that economics is inexact by design. The Nobel Prize in Economics typically goes to an individual or team that does a very good job of rationalizing why rich people must be rich and why poor people must be poor. University economics departments tend to go along with the status quo because of a revolving door with industry and a need to help lead graduates into jobs with corrupt institutions. There are certain, unwritten rules of politeness that prevent “respectable” economists from telling things like they really are.

Economic analysis is not especially difficult, and it is not surprising that a vast number of websites have sprung up on the web attempting to give better analysis than that which is given by the economic establishment. Many individuals and organizations have created websites that call it like they see it, and this blog fits into that classification. These opinions are often branded as “gloom and doom,” “fear mongering,” “conspiracy theories” or with other derogatory terms in an attempt to discredit the views expressed, although the arguments are seldom countered in a rational manner.

Having observed and followed the “Economics Underground” (as I choose to call it) for several years, I find it to be a valuable source of information, but also susceptible to a form of groupthink that often leads to false conclusions. Indeed I started this blog because I feel the Economics Underground is totally missing the story of the Rebalancing process.

Economic Undreground sites tend to focus entirely too much on Austrian Economics, the Gold market, and manipulative actions by major financial institutions. While the Austrian school offers much to the understanding of economic conditions, we are now living in a Keynesian world, and the rules of the game have been altered. Booms and busts are still very much a part of the landscape, but credit contraction and deflation are not the dominant forces that Austrians tend to predict. Many in the underground elevate gold to a standard that is not realistic in the modern world. The actions of financial institutions are two often assumed to be manipulative or part of a larger conspiracy.

In general I think the Underground looks for clues in the right places, but does not view events in the proper degree or with an open enough mind. To the extent that members of the underground seek to gain attention with radical claims the educational goals of the underground can be undermined. To the extent that the underground fails to thoroughly debate its claims and accusations, it fails to improve its message and arrive at a better understanding of the economic landscape.

I realize that I have to guard against making the same mistakes and keep an open mind to differing viewpoints on the issues of the rebalancing process. To that end I welcome debate on the ideas I present on this blog. Failure to thoroughly understand the process could have direct financial consequences for my investing portfolio and it would do a disservice to anyone reading the blog.

Of all the sources in the economic underground, my favorite has to be the Mogambo Guru as his columns mix in a number of interesting economic facts in an entertaining format that catches the Cassandra complex we all deal with as enlightened economic observers.

Russ Winter also has an excellent blog that I check daily that is full of interesting links and statistics, even if I think he often goes overboard on his analysis. He’s run a message board on Silicon Investor for a long time and has a large following that contributes interesting links and ideas.

Mike Shedlock also runs message boards and has a good blog, that is educational, even if it doesn’t have much of value for my investing purposes and the rebalancing concept.

Those are just 3 sites that belong to hard working individual members of the Economics Underground. There are many more extensive and professionally done websites and newsletters out there. If any readers have their own favorite sites, please go ahead and share them in the comments section.

Monday, August 21, 2006

How Could This Happen to Us?

America's days as a dominant economic power are numbered. The remaining days of middle-class excess are even fewer. When we go to the mall and see people with bags of goodies they don't need, and when we're stuck in traffic surrounded by gas hogging SUVs, and when we're walking through the financial district of a big, bustling city it doesn't seem like the country is on the brink of an economic meltdown. You only get that impression by looking closely at the numbers and really understanding what they mean: We are hopelessly buried under a mountain of debt so large that it will soon radically alter our standards of living.

This blog entry isn't about exactly how big that debt is. I've been charting, quantifying and explaining that for the past month and a half. This entry, as the title suggests, is about how we got into this position. Simply stated: It happened because certain people in power wanted it to happen and because other people in power didn't care or didn't understand what was happening but benefitied from it anyway.

Here's who made it happen:
Foreign governements
Multinational corporations

Here's who let it happen:
Politictians
Wealthy Americans
Clueless Voters

Friday I outlined how the mounting trade gap benefitted foreign countries by building up their wealth and infrastructure relative to the US. US-based multinational corporations have been instrumental in this process as their profits have grown tremendously as a result of outsourcing cheap labor and growing sales in developing markets. Looking at statistics for employees, capital expenditures and sales for US multinational coprorations it is easy to see how their growth has shifted away from the American marketplace.

From 2000 to 2004, US multinationals:
Reduced US employment by 10.93%.
Increased foreign employment by 1.55%.
Reduced US capital expenditures by 21.55%.
Increased foreign capital expenditures by 15.06%
Increased US sales by 2.55% (a substantial reduction in real terms).
Increased foreign sales by 30.91%.

As American business leaders sought to boost profits, it made good business sense to look abroad for growth. Along the way, they lobbied our leaders in Washington for "free trade" agreements that have undermined the competitive advantages of Amercian production and the standard of living for American workers. The US consumer temporarily benefited from the inflow of cheap goods and easy credit, but will soon be left with a massive debt hangover and reduced earning power when the bills come due.

Politicians have needed the financial support of large corporate donors to win elecions in media dominated campaigns. They've passed the laws the multinationals have written for them and they have made the profits of multinational corporations the basis for international policy. In pursuit of their own, selfish political objectives, they've let the problems grow.

Wealthy Americans have also been complicit, as they've invested in the multinational corporations and benefited from cheap foreign and immigrant labor. Wealthy Americans prosper when the masses can't bid up the prices for luxury items and travel packages. They're existing assets have been inflating as the the global economy became imbalanced, and they'll be able to pick up the assets of middle-class Americans on the cheap as the rebalancing process takes its toll, so whether or not they understand the system, they are glad to let it continue.

Clueless voters don't understand the nature of our political process and how it serves multinational corporations. They don't understand how the national debt and trade gap are undermining their future living standards. Clueless voters know that life is hard, but the change has been so gradual that they can't connect the dots. They continue to get sidetracked by the usual divisive issues lobbed at them by the two political parties and miss the big picture.

The rebalancing process does not have to be painful, but based on the actions and interests of people in positions of power, it appears certain that it will be. Perhaps a sharp economic shock is necessary to wake people up, as the voting masses and people who would otherwise care don't seem smart enough to understand where things are heading and how to reduce the suffering it can bring.

Sunday, August 20, 2006

Rebalancing Takes a Step Backward

The Fed caught a breather on all three of the main threats it faces from the rebalancing process:

Options expiry week is always an interesting time in the market and with the rebalancing process underway it tends to be a time for the process to step back and let the risk underwriters reduce their pain. Not surprisingly, it wasn't a good week for the short side of the rebalancing trade:
It's a common trap for investors and traders to blame manipulation by the big boys when things don't go their way. Personally, I blame myself when I don't correctly predict which way the big boys will manipulate things.


I see some interesting themes in looking at these charts of the Commitment of Traders data.

Commercials are the traders who take positions mainly for hedging purposes. As I understand it, the big broker banks tend to make up a large portion of the commercial position. If manipulation of the markets is taking place, then it could show up in the commercial position. The commercials also tend to be on the winning side of trades, because they are the ones who are big enough to influence the markets and manufacture their own good fortune. They make their bets, then make their bets successful, unless they try to push it too far.

Looking at commercial positions in various areas of the futures markets:

Currencies:
Euro = 15% bullish, choppy = Extremely Short
British Pound = 20% bullish, declining = Way Short
Swiss Franc = 65% bullish, rising = Long
Japanese Yen = 62% bullish, rising = Long
Canadian Dollar = 34% bullish, choppy = Short
Mexican Peso = 35% bullish, declining = Short

I tend to think the Euro is being held down by commercials. A lot of speculators probably bought the Euro and Pound on the recent pause by the Fed and surprise hike by the Bank of England. If the Fed starts raising rates again, it will probably boost the dollar relative to the Euro and give commericals a good exit.

Long the Yen? Perhaps betting that Japan will tighten more.

Short the Loonie and Peso? Perhaps they are related to the Euro/Pound as an dollar boosting story.

Commodities:
Crude Oil = 47% bullish, declining = Slightly Short
Natural Gas = 45% bullish, declining = Short
Gold = 24% bullish, flat = Way Short
Platinum = 16% bullish, declining = Extremely short
Silver = 24% bullish, flat = Way Short
Copper = 55% bullish, rising = Slightly Long

Speculation into Oil hitting $80 or $100 on the pipeline closure appears to be wrong in the short term. Commercials probably sold into the panic buying and will ride it out as traders give up and take losses. These are the widely traded contracts, so 47% can still be a big bet on the short side.

Bankers hate precious metals. They once were the bane of fiat currency and extreme credit expansion. Now fiat is here to stay, but bankers still hate them.

Equities:
Dow Industrials = 30% bullish, flat = Short
S&P 500 = 49% bullish, rising = Neutral
Nasdaq 100 = 55% bullish, choppy = Slightly Long
Nikkei = 43% bullish, declining = Slightly Short

Nasdaq took its lumps early in the bear market. Large caps towards the end?


Bonds:
30-Day Treasury = 51% bullish, declining = Neutral
2-Year Treasury = 54% bullish, rising = long
5-Year Treasury = 53% bullish, choppy = Slightly Long
10-Year Treasury = 45% bullish, declining = Short
Treasury Bond = 55% bullish, choppy = Long

Here's our perverted yield curve, with the 2 and 5 year strangly down with the 30 held down too:


Speculative hedge funds may be betting on a return to a more normal curve in the mid range, leaving commercials to keep buying those durations, pushing down the yields. They don't have to be fundamentally right to win. They just have to last longer than the specs.

Friday, August 18, 2006

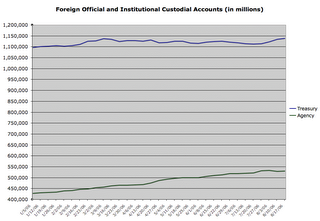
Foreign Official and International Accounts at the Fed bought up over $25 Billion in treasuries over the past month, bailing out the treasury and contributing to a sharp decline in long term yields. Nice work, Paulson!

Just as in February, they came through when the US government was most desperate for cash. Unlike in February, however, this time foreign buyers stopped buying Agencies while they were gobbling up treasuries. Except for the February and August surges Treasury demand has been weak from foreign official accounts:


Looking at a longer term view, we see Japan's big currency intervention in early 2004 leading to a surge in treasury holdings. That leveled off into a relatively steady accumulation of treasuries. Then there was a large shift out of treasuries into agencies:


Have we reached another turning point where agencies also go out of favor? I can't fault the strategy of foreign central bankers:
Step 1. Drive your currency down to decimate the American manufacturing base and boost your own productive capacity.
Step 2. Fund the US government's military misadventures to bankrupt the US and cause destruction in other developing parts of the world.
Step 3. Fund the overconsumption of the American consumer, turning them into your debt servants through mortgage backed securities.
Step 4. Use your wealth to command the lion's share of the world's natural resources in times of scarcity.

Thursday, August 17, 2006

Homebuilders know something is wrong with their industry. They just haven't figured out what it is yet (hint: it's the rebalancing process). Homebuilder confidence has taken the biggest and steepest dive ever, and it isn't anywhere near over yet:
They are still selling a lot of homes, just not as many as they were over the last two years, and not as many as they thought they'd be selling when they made their business plans for the coming years.:

Thanks to an endless supply of misinformation from industry economists, the public has been very slow to realize that housing is heading into another multi-year decline. Ignoring the extreme froth of the past two years, housing demand remains high on a historical scale. It still has a long way to fall from here because American homeowners aren't going to be able to afford as much home over the coming years.

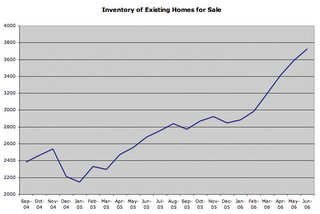
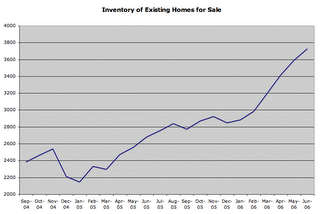
Builders don't understand that the rebalancing process is slowly but surely squeezing people out of being able to afford to buy and live in typical single family homes. Foreign purchases of mortgage backed securities over the past few years provided easy credit for home buyers, but that credit is drying up and many borrowers are realizing they can't make the payments now that living expenses are rising and their ARMs are resetting. The number of existing homes for sale on the market is exploding:
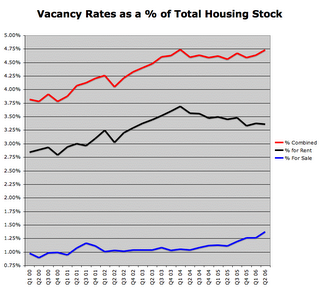
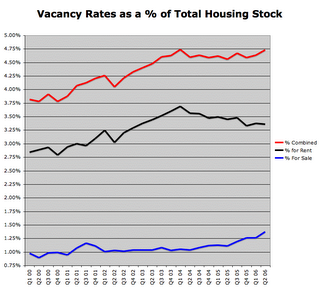
Vacant units are at an all time high, with rental vacancies declining, but still historically high. Meanwhile vacant units for sale keep rising because homebuilders have been building far more homes than the country needed:

Seeing the trend in rising demand for new homes and condos, builders bought up land and made plans to keep building at an accelerating rate on into the next decade. The trend changed direction and caught them off guard. They're cancelling land option contracts, but still have far too many communities and condo towers under development. Many unsold condos will end up as rental units eventually, so the condo boom isn't all that bad a thing, but the single family residences in the outer suburbs are going to be an albatross around the builders necks. Eventually Americans will come to realize that the single family McMansion with a 1 hour commute isn't a cost effective way to live. The rest of the world already has cost effective housing. America will be forced to adopt more of it as the rebalancing process continues.


Orleans Homebuilders is arguably the worst run of all the homebuilders based on their stock performance over the past 5 years and the abysmal failure of most of their acquisitions. Orleans set a new standard for futility in Q2: They reported negative New Orders for a region.

On the conference call they mentioned that they had 99 cancelations and 51 gross sales for net sales of-48.
Another oddity: Total average selling price is higher than average selling price in any one region. That's because Florida's average selling price is the lowest of their regions and subtracted a smallish amount from total net sales. No doubt low-end buyers are feeling the squeeze hardest and first. This, along with the incentives builders are opting for rather than price cuts, is masking the fact that home prices are now declining in most areas. That trend will get much worse as a rising number of foreclosures wreaks havoc on the market.

Dominion and Levitt were the first homebuilders to report losses (in Q1 of this year). Comstock joined them in Q2. Orleans hasn't joined them yet, but they did lower guidance from $3.05ish to $1.88ish for the year ending 6/30/07, this with backlog down from 1406 to 715 year over year. That new estimate is still too high, and I'll be surprised if they don't start showing losses (along with most builders) in the March quarter of 2007.

Q2 was actually still a good quarter for the industry. Sales began falling much more rapidly in July and August, as evidenced by the builder confidence chart. As I keep repeating: This housing slump is only just beginning because the rebalancing process is only just beginning.

Wednesday, August 16, 2006

Inflation and the Rebalancing Process

Inflation is good if you are deeply in debt. The relative size of your debts shrink, as the value of the dollar declines. The roughly $10 trillion we owe to foreigners will be very easy to pay back if we just print up the the money and ship it to our creditors on the next boat heading out of port. Unfortunately, that would be just a wee bit inflationary. As of last Wednesday there was only $795.862 billion of currency in circulation. Banks wouldn't want to increase the size of their deposits and loans more than 10-fold, and as people, companies and governments tried to spend and invest the money, the price of just about everything would shoot up by a factor of at least 10.

Nevertheless, the size of our debts has become so overwhelming that continued monetary expansion seems to be the only way to keep up with payments. Most of our main creditor nations appear to have pulled the plug on our credit lines, leaving the Fed to inject more when needed and hedge funds to borrow more money into existence to buy up new Treasury debt. Other countries helped keep inflation down in the US for a long time by building up reserves of dollar denominated assets, but they seem to be reaching a saturation point. For those reasons, we can expect inflation in the US to be high for many years to come.

Inflation in the US is the worst among 9 major economies. While the countries in that report all use slightly different methods and inflation numbers are highly politicized, I think the general impression given by the report is valid:
1. Inflation is rising globally.
2. Inflation is worse in the US.

As bad as the published numbers are, the real story is probably much worse. Our government tries to keep published numbers down to maintain confidence in the economy and keep the cost of entitlement programs under control. It does this in 4 main ways:
1. The use of hedonic adjustments to lower price increases on goods that are supposedly improving in quality. (note that I've never seen a downward hedonic adjustment for all the goods and services that have deteriorated in quality)
2. Adjusted weightings to favor goods that have slowly rising costs over goods that have rapidly rising costs.
3. Excluding the effects of supply disruptions that boost the costs of certain goods.
4. Focussing on a "core" rate that ignores the rise in cost of the things people need most to survive.

Even with all the fudging that goes on, inflation remains high in the US economy, with the CPI coming in at 4.1% over the past 12 months and a 4.5% compound annual rate over the last 3 months. Anything over 2% is considered unhealthy because it distorts economic decision making, so we still see rationalizations and excuses whenever the Fed or government officials are feeling pressured by the numbers.

It's a game that has been going on for over a year now and should continue going forward. The Treasury needs money supply expansion (and therefore inflation) to keep paying its bills without draining to much money out of the private sector. The Fed will keep talking down inflationary risks and long term interest rates and talking up the dollar to protect the primary dealers. Yet, the dollar will continue to trend down, the economy will contract, and the purchasing power of the American consumer will erode. Measuring the rate, timing and nature of those declines is a major purpose of this blog.

Tuesday, August 15, 2006

TIC Trends

June TIC data came out today, showing more of the same themes:

Reduced purchases by official accounts and net sales of US treasuries.
Private foreign accounts picked up the slack, but I suspect those are largely hedge funds doing the buying and borrowing much of the money into existence to do so.
Corporate bonds remain a favorite of foreign investors.
They've been deserting US equities, lately.

The more interesting data is found in the Major Foreign Holders report that the media always seems to ignore. The data is important for the rebalancing process because it gives a clue as to how much money is being invested by foreigners back into treasuries and how much Americans have to print to pay the bills. The data is revised after processing a big survey every June, and current data hasn't been revised yet. The revision recalculates how much of the treasury debt that is sold into major banking centers (like the UK and Switzerland) is being held for investors from other countries. Trends in that data are interesting enough on their own.

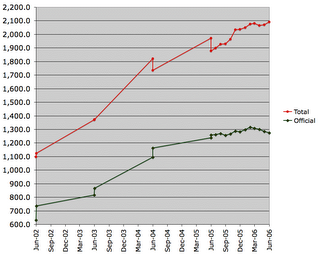
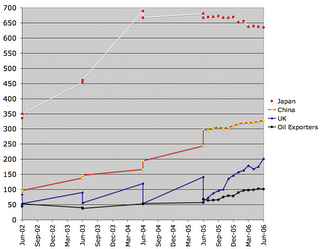
Here are a couple of charts I conjured that includes historical MFH data:

The above chart shows that in the past couple of years much of the money bought into foreign banking centers was actually purchased for US clients. Consequently, major foreign holdings will likely be revised down substantially when the next data series begins next month.
The chart also shows that official accounts clearly began reversing course in March, about the time the dollar took a dive.

The second chart shows how Japan, China and Oil Exporting countries have been the largest financiers of the Federal Debt. Japan has been reducing holding substantially, and since they appear to have become a financial center, we'll probably see a good downward revision after this year's survey is processed.
China has seen the biggest increases in past surveys, and we'll probably see a huge jump this year based on the rapid growth of UK holdings over the past 12 months (UK holdings always get revised down the most). Oil Exporters and Caribbean banking centers typically get a big boost with the revision, so we'll get a hint about the role of Caribbean hedge funds (relative to UK based hedge funds) in financing the debt with the next revision as well.

Other data I've been watching suggests that China is letting the dollar float a little more freely and slide at a faster rate, so they may be buying even less debt now, leaving hedge funds and oil exporters to pick up the slack. It's an evolving story, and one I'll keep watching.

Monday, August 14, 2006

Seeking Comments

The comments readers have offered so far are greatly appreciated. I apologize that I generally don't have time to respond directly to comments. Time will be getting even shorter in a couple of weeks, so I'd like to hear from visitors to this blog what they've found to be most interesting so far and what they'd like to see more of in the future. Links to related articles and websites are also appreciated.

Feel free to respond anonymously and to any post that you like. I get an email whenever someone responds to any post, so don't worry about me missing it.

Sunday, August 13, 2006

Car Makers and Car Dealers Have a Growing Problem

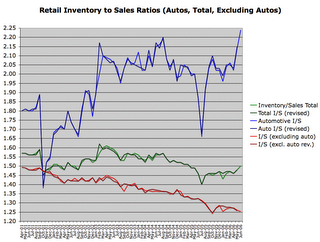
Retail inventories have been in a long-term downtrend as retailers have become more efficient at inventory management. That trend is shown in this chart of inventory to sales ratios from the Census Bureau:

The times when Inventory/Sales ratios are rising typically come in economic slowdowns and recessions, as seen in the 1995 and 2000-2001 periods. If those ratios are picking up now, then it provides further evidence that we are heading into an economic slowdown.

Automotive sales make up about 1/4 of total retail sales in the US. When there is a big uptick in car sales it has the effect of bringing down inventory to sales ratios for the entire retail sector. I created my own chart based on data from the Census Bureau, adding a couple of lines with a calculation of retail I/S excluding automotive sales:

It is interesting to note the way automotive inventories have run counter to the broader trend in retail. Except for a couple of notable downward spikes, automotive inventories have been building and took an especially large jump in May and June to new record highs. Short sighted decisions by auto executives have handcuffed Detroit's big car makers, leaving them on a path toward bankruptcy:
-In order to keep wages down, they've made job security guarantees that prevent them from cutting production in the face of falling demand.
-They've opted to produce mostly high margin, gas guzzling muscle cars and SUVs instead of going after first time buyers with economy models.
-They've made generous promises regarding retirement benefits that have proven impossible in the era of escalating health care costs.
-They've stuffed dealer lots full to the bursting point so that they can report those cars as sales in their quarterly earnings reports.

All this leaves Detroit in a bind where they have to keep producing more cars than they can sell profitably. Periodically they try to promote their way out of the problem. They had great success post 9/11 with a patriotic call to Americans to defeat terror by purcahising gas guzzlers with 0% financing. They also did very well by offering deals on unloved models at employee pricing last summer. While those efforts cleaned inventory out of dealer lots, they also resulted in substantial financial losses. In both cases it didn't take long for inventory levels to bounce back up to new highs after the promotions had ended.

The upswing in overall I/S of the last several months coincides with the onset of global economic rebalancing and shows that the retail sector has begun feeling the pressure of the rebalancing process. It should get much worse before it gets better, as the rebalancing process has a very long way to go.

Here's part of an old post of mine from 12/22/05 going into greater detail on the nature of GM's problems:

The two most spectacular stock meltdowns of this century have so far been Worldcom and Enron. GM has the potential to outdo both of them in terms of total damage. While vast amounts of shareholder wealth were lost as the first two frauds unraveled, GM's eventual default will likely result in far more lost wealth. Worldcom had roughly $30 billion in debt when it went under, but GM has almost 10 times that amount.

Not included in GM's official debt is over $60 billion in unrecognized benefit plan losses. My reading of the last 10-K has GM with a "fully funded" pension plan that has $38 billion in Pre-paid expenses recorded as assets offsetting $36 billion in unrecognized loses. In other words, GM is pretending to have $38 billion in pension plan assets that really don't exist because they haven't gotten around to admitting how much money the pension plan has lost. On the Other Benefits side, they've recognized $28 billion in losses so far, and eventually expect to recognize another $28 billion. The main reason why the pension plan trust is fully funded is that the law requires it. Meanwhile, the laws governing Other Employee Benefit Plans are not as strict and there is a mere $16 billion in assets in the benefits plan trust while GM calculates it would need to have $61 billion in the trust for it to be fully funded.

In both cases accounting laws allow GM to dramatically overstate earnings and book value by postponing the day when the expenses are recognized. With so few assets set aside in the benefits trust, it fell behind by an additional $4 billion in 2004, even after GM added $5 billion in assets to the plan. In my mind this constitutes somewhere around $8 billion in losses that should have been reflected on GM's earnings statements. While not recognizing those losses may have been legal under current accounting standards, the earnings as stated to the public are highly misleading. At the end of 2004, GM had only $27 billion in shareholder equity. Had those pension and benefit plan losses been recognized, GM's shareholder equity would have been less than a negative $30 billion. In the first 9 months of 2005, GM's liability for other benefits increased by $4 billion and they have reported $3.8 billion in net losses as reality began catching up with the company.

A big lesson learned from Worldcom and Enron is that a fraud can go on as long as creditors are willing to lend cash to the fraudulent enterprise. Once creditors lost faith in those two companies they had to declare bankruptcy. GM is far more dependent on the faith of creditors as its finance division has been their main source of apparent profits in recent years. GM borrows hundreds of billions of dollars and lends it out to its auto customers and to homeowners through its mortgage lending unit (Ditech). With GM's credit rating cut to junk status, the profit margin it can make in its financial unit is reduced. As GM's financial conditions continue to deteriorate, the supply of willing creditors will continue to diminish, and eventually GM will be bankrupt.

Just as GM has much flexibility in the way it chooses to recognize or postpone recognition of benefit plan losses, GM has great flexibility in the way it books earnings from the loans it makes. If it conservatively assumes that many of the loans will end up defaulting and costing the company money, then it will set aside substantial reserves and book smaller profits. If it assumes that good economic times will continue and few loans will default, then it can book much higher profits. Given the way GM has chosen to account for their pensions and the way their backs are pressed to the wall with their creditors, I'm willing to make the assumption that they are similarly overstating earnings in their finance unit through aggressive accounting. If this is so, then we can expect a large number of write-offs as deteriorating economic conditions force GMAC customers into default...

When it all shakes out in the bankruptcy courts, the bag holders will be many. As an S&P 500 and Dow Industrials component, GM is a core holding in almost every retirement plan in the country. Those plans will all face additional losses as a result of the disappearance of GM's imagined wealth. This in turn will eventually impact the bottom line for other companies pension plan operations. GM has over $400 billion in liabilities, including about $250 billion in debt. These liabilities will probably be repaid at some fraction of their stated value, meaning the corporate debt market and its many highly leveraged hedge fund participants will take a highly leveraged blow to the gut. There could be much forced selling as corporate bond positions lose value and wipe out fund equity.

Enron taught us about off-balance sheet debt, and how many risks aren't known to shareholders even if they take the time to read a company's financial statements. In the case of GM, a vast, unknown quantity of off-balance sheet liabilities exist because GM guarantees payments on many of the loans they sell and service. If and when the economy slows and defaults rise, GM has guaranteed the purchasers of hundreds of billions of dollars worth of asset backed securities that GM will make up for missed the missed payments of borrowers. Of course an insolvent GM won't be able to make good on those promises and much imagined wealth will evaporate.

Perhaps the full scope of the situation and the lack of any viable solution has led GM executives, Wall Street, and Washington to turn a blind eye to GM's problem. Perhaps individual greed and systemic neglect has led many to profit off the situation, rather than attempting to fix it. GM's implosion has of course been building in degree for many years, but nobody was willing to take leadership in dealing with it. As a result of avoiding the problem when it could be officially dealt with in good times and a strong economy, GM's crisis must now come unraveling just as the government is facing its own growing debt crisis and as the pension problems in both the public and private sector are coming to a head. Worldcom and Enron finally imploded when (and likely because) the economy was in recession. The fact that GM appears to be imploding when official government numbers are showing solid economic growth is both an indication of the massive underlying problems at GM, and the massive underlying problems within our economy as well.

Saturday, August 12, 2006

The Financial Markets and Global Economic Rebalancing

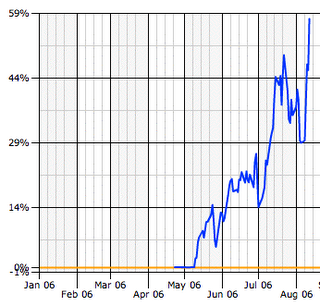
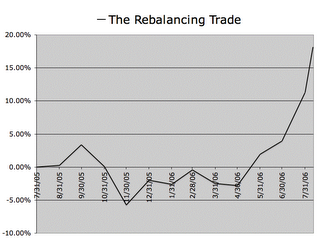
The Rebalancing Trade has had a pretty amazing run of late. Here's the recent performance of a leveraged, mostly-short account that makes up part of my rebalancing hedge strategy:
That account is balanced against another account that is mostly long and unleveraged. Combined, the accounts constitute the rebalancing trade, which has been working since November, about the time I estimate the global economic rebalancing proces reached an important turning point:
Some important disclaimers:
1. There has been a lot of luck involved, as well as a lot of time spent researching individual stocks, some active contrarian trading and a little bit of sector rotation. These results are a very crude gage of the overall rebalancing strategy.
2. Usually when I have a run of good fortune like this, it is quickly followed by a period of getting knocked on my behind by the markets. With that in mind, I reduce the overall risk and leverage in the accounts when they are having a good run. If anything, recent success should be viewed as a predictor of imminent failure in the markets.
3. The size of the accounts is relatively insignificant. I'm not rich, and I'm sure I'd be doing much worse if I had to manage millions of dollars over the long term. If I was managing a large amount of money, I wouldn't be sharing my thoughts on the markets for that matter.
4. I don't encourage anyone to try and duplicate my trading strategies. The stock market has a way of making sure the masses lose out. The more people trying to play the rebalancing trade, the more likely it is to fail.

That said, I believe that my recent good fortune adds evidence to the idea that the rebalancing process is well underway. I think that the markets have been demonstrating this strongly over the past 3 or 4 months and the charts above provide evidence for the main ideas of this blog.

In the 8+ years I've been trading stocks, there have been periods of time when I believe the markets have been moving away from what I consider to be reasonable valuations and periods of time when I think the markets have been moving toward reasonable valuations. That holds true for the market as a whole, as well as for individual sectors. As the rebalancing process still has a long way to go, I think it likely that the rebalancing trade will continue to work on some level.

Friday, August 11, 2006

Who's Buying Treasuries These Days?

The treasury has been issuing a large amount of new debt recently as July and August are slow months for tax revenues. Total debt went from $8.420 trillion on 7/28/06 to $8.460 trillion on 8/10/06, with another big chunk being funded on 8/15. With Japan and Korea reducing their treasury holdings in recent months, it appeared that the Treasury would have a difficult time and rates were likely to rise. Finding buyers for the upcoming auctions was probably on somebody's agenda for the G-8 meeting in Russia July 15-17.

The auctions have gone surprisingly well, even though President Bush failed to make new friends in Moscow. Indirect bidders have taken a good percentage of the debt, and foreign official and international accounts have surged in the past 3 weeks. So the question that comes to mind is: Has the foreign investment part of the rebalancing equation been put on hold?

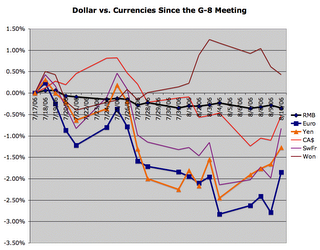
To try and answer that, I want to know who is doing the buying. The Major foreign Holders report for July won't be out until mid-September, so I look for clues in foreign currency fluctuations:

Of the main currencies I track, only the Won is up since the G8 meeting. Perhaps the South Korean central bank decided to boost treasury holdings. The Korean national pension fund recently said they be buying fewer US treasuries and more agency debt in the future. Interestingly, agency holdings declined by the most since the last week in March of 2003.

China added $15.3 billion in treauries through the first five months of 2006. The Chinese currency began it's sharpest rise against the dollar at the end of May (see chart below), so it may be that they've already joined Japan and South Korea in shunning US treasuries.


The other main candidates would be whoever has been snapping up treasuries in the UK and Oil Exporters. The UK gobbled up $28.7 billion in treasuries through May (probably hedge funds), and oil exporters increased treasury holdings by $24.6 billion during the first 5 months of the year, while Japan was reducing holdings by $31.1 billion. No doubt oil exporting countries are rolling in surplus dollars these days. The Saudis may have gotten a friendly phone call from the new bond salesman from Goldman Sachs. The Hedge Fund angle remains just a theory because hedge funds don't typically disclose their holdings or who's giving them money. To me it seems most likely that puppet governments in the Middle East and puppet hedge funds in the Channel Islands have been doing the buying ever since the legitimate buyers got wise and began an orderly exit from the market. Both of those groups may have custodial accounts at the Fed. I remain skeptical other foreign holders have decided to reverse course in the last 3 weeks. We'll know more in a couple of months.I don't think Korea, China or Japan have been big buyers, which leaves two main candidates:

Thursday, August 10, 2006

June Trade Gap Numbers

Trade gap figures for June came out today at $64,804,000,000.00.
May was revised up from $63.835 billion to $64,974,000,000,00.

Some things that jumped out at me from the report:
1. The trade surplus in services declined for the second month in a row, including a significant downward revision in May's number.

Reaching this point was likely, given how America has sold off so much intellectual property and how the rest of the world has caught up enough in terms of education, training and expertise. If the dollar can fall substantially, then the service surplus may start rising again. The powers that be don't seem willing to let that happen, so we'll be forced to sell off a more of our economic advantages and assets.

2. The petroleum trade deficit has risen to 35% of the total goods deficit, up from 28% a year ago.

This should get even worse with BP taking 400,000 barrels of Alaskan production off line. It could add about $1 billion to the trade gap each of the next couple months, depending on oil prices and whether or not we tap into the strategic reserve. When BP was allowed to purchase ARCO a few years back, it was another example of the US selling off important economic interests to fund the trade gap. Foreign acquisitions of US companies and assets have continued at an accelerating rate, and we can't expect foreign companies to run their US subsidiaries in the best interests of the US economy.

Brazil has achieved energy self-sufficiency with it's ethanol program. We could do the same and be world leaders in the field of alternative energy sources... just not with this president.

3. The trade deficit for non-petroleum goods has been trending down all year and is down year-over-year.

This is where the squeezing of the American consumer is showing up. Rising energy prices and debt service aren't leaving much money left for discretionary spending.

The following chart shows recent trends from the Trade Gap report:

Wednesday, August 09, 2006

The Sub-Prime Time Bomb Detonated Today

Take a look at today's performance for publicly traded sub-prime lenders:

LEND -17.24% (lowered earnings guidance by about $3 per share)
IMH -11.31% (somebody goofed and filed the 10-Q an hour early)
AIC -10.85% (being acquired by LEND)
NEW -6.22%
NFI -3.82%
DFC -2.03%
ECR -2.44%
SAX +26.16% (being acquired by Morgan Stanley, just in time to save somebody's behind, as earnings stunk as badly as the rest of them)

These upstart lenders fueled the housing bubble by loaning far-more-money-than-they-could-ever-pay-back to people-who-never-should-have-been-buying-homes. It was only a matter of time before defaults got rolling to the point that the sub-prime lenders took a big hit on earnings. Of course it will get much worse from here. The rebalancing process is only just beginning.

From listening to the Accredited Home Lenders conference call it seems clear that LEND and other sub-prme lenders iare getting squeezed on multiple fronts:

1. Competitors from Alt-A have gone from 680+ down to 620 FICO, muscling in on LEND's sweet spot.
2. The secondary market for High LTV, Stated income, and low FICO has dried up. Investors don't want the garbage anymore.
3. In 2005 they relaxed standards and are now seeing more defaults. They've decided to tighten up some.
4. Sales people quit at LEND because they were pushing quality and margins. Salespeople are getting big bonuses at small upstart companies. The execs wouldn't answer the question as to whether the upstarts are private equity funded.

LEND is being forced to repurchase bad loans they had previously sold to investors. If a loan defaults in the first year or so, the investor can make them buy it back. This is also true for loans where there's obvious fraud. It seems that the investors are quick to find reasons to send problem loans back to LEND. These don't show up on losses, but instead get resold at a discount and cut into margins of new sales. LEND thinks this trend will wind down by the end of the year. I think its just beginning.

From LEND today: "Delinquent loans (30 or more days past due, including foreclosures and real estate owned) were 3.76% of the serviced portfolio at June 30, 2006, compared to 2.47% at December 31, 2005 and 1.79% at June 30, 2005."

From AIC today:
"Percentage of delinquent loans serviced (period end)"
June 2006: 8.2%
December 2005 5.4%

From SAX today:
($ in thousands)        June 30, 2006  March 31, 2006   June 30, 2005
--------------- --------------- ---------------
Principal Principal Principal
balance % balance % balance %
--------- ----- --------- ----- --------- -----
30-59 days past due $370,309 5.53% $273,044 4.20% $307,766 5.04%
60-89 days past due $ 92,635 1.38% $ 82,061 1.26% $ 83,148 1.36%
90 days or more past
due $ 72,494 1.08% $ 58,311 0.90% $ 46,542 0.76%
Bankruptcies (1) $121,559 1.81% $128,280 1.97% $126,391 2.07%
Foreclosures $127,185 1.90% $118,140 1.82% $105,782 1.73%
Real estate owned (2) $ 53,234 0.79% $ 50,039 0.77% $ 41,972 0.69%
Seriously delinquent %
(3) $435,268 6.50% $397,474 6.12% $367,013 6.01%


From IMH today:
"60+ day delinquency of mortgages owned"
June 30, 2006 = 4.16%
December 31, 2005 = 3.12%
June 30, 2005 = 2.01%

The tide has turned for the American consumer, and sub-prime borrowers are feeling it the worst.


Here's something I posted about the Sub-prime lenders on my board on the Motley Fool back on 12/26/05:

Sub-Prime Time Bomb

Quick Summary: 2006 and 2007 will be bad years for Sub-Prime lenders because of rising delinquencies, reduced originations and tightening profit margins.


The housing market and interest rate environment has been good to lenders over the past decade. From 1993 to 2003 interest rates trended down, while home prices trended up. Charge-off and delinquency rates on real estate loans were low, and even during the 2001-2002 recession, they stayed much lower than the 1991-1992 recession.

The peak delinquency rate on residential loans was 3.36% in 2nd half of 1991, and the low point was 1.42% in Q1 2005.
The peak charge-off rate on residential loans was 0.27% in 2nd half of 1992, and the low point so far has been 0.07% in Q4 2004.
http://www.federalreserve.gov/releases/chargeoff/default.htm

Will we cycle back up to high charge-off rates?
-No if you believe that the economy is sustainable and doing fine. However, my answer is:
-Yes, if we have an economic slowdown with falling home prices, or
-Not yet, if we have inflation continually driving up home prices and allowing more cash-out refinancing.
Lately the trend has been toward rising rates and falling profit margins on existing fixed rate loans. We are also seeing more defaults on ARMs and the carry trade would suffer on fixed rate mortgages.
We would probably need to see a big uptick in delinquencies before charge-offs increased substantially, and that may be on tap for 2006.
When hurricane losses finally get recognized (postponed to December, then February) we may see the delinquencies and charge-off rates move noticeably.
There may also be some increased action as the result of the bankruptcy surge in Q4 2005 and the reduced ability for bankruptcy filers to keep their homes under the new law.


From the latest Accredited Home Lenders (LEND) 10-K:
"We focus on borrowers who may not meet conforming underwriting guidelines because of higher loan-to-value ratios, the nature or absence of income documentation, limited credit histories, high levels of consumer debt, or past credit difficulties."

This period has been especially good to sub-prime lenders who've done well by taking on higher levels of risk. Their markets have been expanding as homeownership rates rose from a cycle low 63.7% in Q1 1993 to 69.1% in Q1 2005. Sub-prime lenders are generally the ones operating on the margin as the change in the percentage of people who can afford 20% down payments is likely low over time. Indeed, affordability is at an all time low in most regions, so sub-prime lending makes home ownership possible for a large segment of today's market. The growth of the sub-prime market has been extreme because of both the refinancing boom and the housing boom:

New Century Financial grew from $606 Million in revenues in 2002 to $975 million, to $1.7 Billion in 2004.
Accredited Home Lenders grew from $201 Million in revenues in 2002 to $435 million, to $661 Million in 2004.

Have we seen a peak in loan demand?
Interest rates were higher in 2005, cutting into refinancings, but property values and new home sales rose (until prices edged down late in the year).
Homeownership rates reached record highs in 2004 and appear to be sliding back down.
New home sales surged to new highs, but housing vacancies are also at record highs, so housing sales and prices probably won't rise and may soon fall.
To me the trends appear to be pointing toward a significant decline in demand for mortgage originations going forward. Sub-prime lenders would be affected most because they are the ones operating on the margin.


From the last 10-K for LEND:
50.3% of 2003's loans were 3-year ARMs, 16.2% were 2-year.
20.3% of 2004's loans were 3-year ARMS, 46.9% were 2-year.

Demographically speaking, there is a very large wave of ARMs resetting in 2006 and causing a big payment shock. That wave is not likely to be as big at other lenders as it is at Accredited because of their particular focus on 2s and 3s. I expect a significant rise in delinquencies of 90 days or more during 2006 as a result of this ticking time bomb. Delinquencies are a blow to the cash position as the lender has to keep paying interest on financing and make up the shortfall on securitized financing deals.

Interest-only loans can be ARMS or fixed rate at Accredited and usually become principal paying 25 year loans after 5 years.
0.5% of 2003's loans were interest-only, 14.2% were interest-only in 2004, and a much higher share have likely been interest-only in 2005.
This could make for another wave of payment shock and rising delinquencies in 2009/2010.


From the latest LEND 10-Q:
"the occurrence of a natural disaster that is not covered by standard homeowners' insurance policies, such as an earthquake, hurricane or wildfire, could decrease the value of mortgaged properties. This, in turn, would increase the risk of delinquency, default or foreclosure on mortgage loans in our portfolio and restrict our ability to originate, sell, or securitize mortgage loans, which would significantly harm our business, financial condition and liquidity. While we have not completed our assessment of potential losses stemming from the recent hurricanes in the southeastern United States, we do not expect the resulting losses to have a material adverse impact on our business, financial condition, liquidity or results of operations.

That's a little hard to believe given the high number of homes that were destroyed without adequate insurance in the Gulf Coast area this year. Delinquencies may not show up until the June quarter because most lenders and the GSEs keep extending grace periods, but losses on many loans will eventually be much larger than for typical foreclosures where homes were completely destroyed.


Accredited's ability to lend comes from five main sources:
1. Warehouse Lending Facility, with $4 billion in short term loans, mostly from big investment bankers (Goldman Sachs, Morgan Stanley, Merrill Lynch, Credit Suisse, & Lehman).
2. Commercial Paper. $1 Billion in ultra-short term financing.
3. Securitized Financing. They sell securities using loans held for investment as collateral for financing new loans. 1 to 6 year terms on the securities.
4. Whole Loan Sales. Accredited sells most of their loans, pocketing quick profits on originations and funding new loan originations.
5. Preferred REIT Shares. $100 Million paying 9.75%.

LEND has kept their financing terms short to boost profit margins, but this adds greatly to the risk factor. They can hedge the risk of rising rates on fixed rate mortgages, but they can't hedge the risk of rising defaults and real estate losses. If Wall St. watches closely, the big investment banks can cut off financing or demand high rates of return to compensate for rising risk. When and if Wall Street pulls the plug, LEND will be bankrupt in short order.
-Warehouse loans are mostly 1 year deals. Underwriters can choose not to renew or jack up the interest rates based on percieved risk of the underlying securities.
-Commercial Paper is similarly susceptible to perceived risk.
-Securitized Financing fuels the Ponzi scheme, where they overestimate their profits and leverage up based on imagined wealth. If loans underperform, then LEND eats the losses. If delinquencies and losses rise, then the leveraged nature of these bets unwinds their equity fast, and they also have to pay higher yields to holders of existing securities to compensate for the added risk.
-Whole Loan Sales are at market rates. The amount of loans held for sale and delinquencies within that pool are rising. Profit margin was down from 1.86% in first 9 months of 2004 on $5.8 Billion in loan sales to 1.41% in 2005 on $7.9 Billion. They can sell loans at a loss if they need to raise cash, but not if it wipes out too much equity.
-The Prefered REIT Shares give an indication of what LEND would have to pay to borrow money at longer term rates, and it is more than they charge borrowers on most loans. No wonder they need to pursue so much short term financing.

The Sub-Prime risk game is making big profits for company executives, Wall Street banks and major homebuilders. Salaries, bonuses and banking fees are pocketed now.
If defaults rise, then first in line to take losses will be the shareholders.
After the lender's equity is wiped out and they are forced into bankruptcy, then creditors take losses on underperforming loans.
A sudden collapse takes out the Warehouse lenders, while a slow death lets them cancel facilities and force LEND to sell more mortgages.
A continuing rise in the cost of short term borrowing means bigger profits for Wall St., eroding profits for the mortgage bankers and great pain for anyone saddled with an ARM.

Therefore, I think the most lilkely scenario going forward is:
Continually rising short term rates from the Fed, leading to...
Mounting delinquencies from sub-prime borrowers, leading to...
Widening spreads and increased borrowing costs for sub-prime lenders, leading to...
The gradual collapse of sub-prime lenders, leading to...
The cancelation of warehouse facilities (protecting Wall St.), leading to...
Credit contraction in the greater economy, leading to...
The bankruptcy of the sub-prime lenders (bag holders), and
Poor returns for asset backed securities (bag holders), eventually leading to...
Market crash, leading to...
Wall St. using up cash and picking up assets on the cheap, leading to...
Ultra-low rates and steep inflation.
Tuesday, August 08, 2006

Fed Marks a Turning Point

The statement came out with the usual BS, blaming the slowing economy on a cooling housing market and rising energy prices while giving themselves credit for past rate hikes:

"Economic growth has moderated from its quite strong pace earlier this year, partly reflecting a gradual cooling of the housing market and the lagged effects of increases in interest rates and energy prices."

They try to make the case that they've done enough tightening already to tame inflation going forward, even though inflation is clearly accelerating:

"inflation pressures seem likely to moderate over time, reflecting contained inflation expectations and the cumulative effects of monetary policy actions and other factors restraining aggregate demand."

While it's customary for the Fed to give reasons for their actions, those reasons don't amount to much. They could have looked at the same data and hiked rates or cut rates and come up with a rationale after the fact. As is usually the case, the Fed took their marching orders from Wall Street and did what was best for bankers.

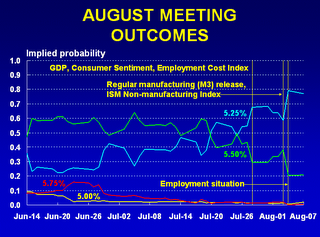
The fed futures called for keeping the Fed Funds rate at 5.25%, so the Fed obliged today.

The primary dealers chimed in this morning as well, with a stingy set of bids on the Temporary Operation.
So the "pause" appears to have been a done deal, but the real question is one of why Wall Street wanted the Fed to stop hiking.

The dollar had been slipping a little, but not falling outright, with custodial accounts building back up a little over the last two weeks. So there wasn't much urgency for higher rates on the Forex front.

Treasury yields had been dropping and stocks had been stable, so there wasn't any urgency for an actual rate cut.

The upstart mortgage bankers have been clamoring for an end to the hikes for a long time, and are reporting a spike in delinquencies this quarter, but the Fed hasn't really cared about that so far, so I don't think they really cared about that this time.

Wall street's bread and butter has been the trading activity generated by hedge funds, and they had another bad month. Fear of more failures could have been the straw that led bankers to halt the rise in hedge fund borrowing costs.

While this is being billed as a "pause," I think it more likely that this is marking another key turning point in the rebalancing process. Heavy inflation will probably stay with us, as that is a way the country can shortchange foreign investors and preserve more wealth for Americans. The economy and financial markets, however, are likely rolling over slowly like a massive oil tanker. Once the process starts, it probably can't be stopped.

It may or may not be the end of rate hikes, as the status of the dollar is a key factor there. It probably is the end of the current economic expansion, for better or worse.

Monday, August 07, 2006

Consumer Credit Takes a Familiar Twist

Consumer debt keeps piling up as the average American continues to spend more than he earns:
(Upspike was due to the big Microsoft dividend. Downspike was due to lost Katrina rent.)

Living beyond your means is easy when you measure your net worth by the inflated market value of your home. Throughout much of the past 5 years, homeowners have been consolidating their credit card debts into new home equity loans. Now that real estate prices are hitting the wall, home equity extraction is becoming impossible for many. Changing habits is a slow process, so for now, consumers are back to running up the credit card debt.

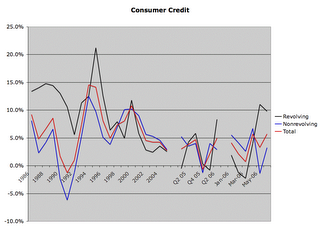
Revolving debt is spiking again, as it did leading to the economic slowdowns of 1990, 1995 and 2001. Consumers are getting squeezed and it is showing on their credit card statements. This will create a greater squeeze in the near future, and rising defaults will eventually bring revolving debt down again.

Meanwhile, consumers are starting to cut back on the big ticket items that usually get financed with non-revolving debt. (Nonrevolving debt includes automobile loans and all other loans not included in revolving credit, such as loans for mobile homes, education, boats, trailers, or vacations.)

Consumer Credit cycles are shown in the following (3-in-1) chart:

Pools of securitized, revolving, consumer credit continue to decline, while securitizations of non-revolving debt picked back up in 2005, mirroring a shift from unbacked US treasuries to asset backed Agency debt. Savvy foreign investors will want to claim some hard assets when the defaults hit. Even if they end up being worth a fraction of the original debts. Something is better than nothing, in return for financing the great transfer of wealth and production capacity out of the US.

Credit is not tightening yet because commercial banks are doing most of the financing now for revolving debt. The banking sector is already so extremely exposed to the great pyramid of debt, that it might as well front some more cash to hopelessly indebted consumers and book profits at 20% interest rates for just a little while longer. If you're an executive at a major bank, the long term risk is the shareholders' and the greater economy's and not yours. Since a big share of the profits goes into this year's bonus check you'd better take it while you can get it.

The same themes continue in consumer credit as in almost every other part of the financial sector:
Foreign investors skate off cleanly from high-risk, unsecured debt into asset backed debt.
American banks take on more risk to keep things afloat just a little longer.
US consumers leverage themselves deeper to put off default and bankruptcy.

It's as if the people in charge of the government and financial sector want the blow up to be as big and painful as possible in the good ole' USA.

Sunday, August 06, 2006

Housing Vacancies

Americans aren't just over-consuming electronic toys and gadgets. They're also over-consuming housing. Thanks to foreign investment in Mortgage Backed Securities, there has been plenty of easy credit for people wanting to purchase more home than they can afford, and plenty of easy financing for builders who want to boost construction. The average size of new homes has increased substantially in recent years, and the number of vacant homes on the market has been climbing rapidly.

In the introductory post of this blog, I provided a chart showing how the trade gap, economic growth and the dollar were all related. In 1987 the trade gap was reaching a short term peak, with the economy overstimulated and the dollar poised for a sharp decline. Housing vacancies were also peaking at that time, and those same conditions are setting us up for an even bigger economic decline going forward.

Rental Vacancies peaked at 8.1% in Q3 1987.
Homeowner Vacancies peaked at 1.9% in Q3 1989.

There was a huge stock market crash in 1987 but the economy didn't slow dramatically until the 1990 to 1992 period when the housing market slowed nationally.  There is a wealth effect that goes with stock market bubbles but housing bubbles involve far more real jobs and much more credit expansion.  When housing bubbles burst, they have a bigger impact on the greater economy and a slowing economy further suppresses housing prices.

Fast forward to the present situation.
Rental Vacancies peaked at 10.4% in Q1 2004.
Homeowner Vacancies set a record high of 2.2% in Q2 2006.
There are many reasons to fear an even greater economic slowdown starting in 2006 based on a more dramatic rise in home prices and extreme private and national debt levels.

(Vacancy data can be found here.)

Looking just at the vacant homes that people are now trying to sell or rent, it becomes clear that too many homes have been built in recent years:

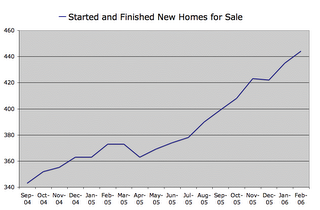
Housing price appreciation led to speculation, which led to increased construction. Prices have begun leveling off and now mortgage rates are putting the squeeze on homeowners who took on too much debt. 2006 is a big year for adjustable rate mortgages to reset, including 3-year ARMs that were popular in 2003, 2-year ARMs that were popular in 2004, and teaser rate mortgages that were popular in 2005. Delinquencies, defaults and foreclosures are on the rise throughout the country, and the number of homes on the market is spiking:

Supply and demand issues will lead to a substantial real decline in the value of housing. Distressed borrowers continue to add to supply (and I count both homeowners and homebuilders in the distressed borrower category) and a decline in the excitement around housing continues to cause a decline in demand. The housing market will get much worse before it gets better.

This is all an unfortunate and painful part of the rebalancing process. Over-consumption of housing went along with the rise of the trade gap as the result of easy credit for Americans. People foolishly saw purchasing a large home (with little down) as an investment, In truth, buying more home than you need is both speculation and consumption. The wealth effect of rising home prices over the past 10 years has helped fuel excess consumption. As housing prices decline, US consumption of imports should also decline because homeowners won't have access to the lines of credit that rising equity provided.

Homebuilders have too much land on their books, and rather than eating their losses, many are still trying to rush new homes onto the market and hoping buyers will materialize. The number of Spec. homes being built is rising rapidly, as new home sales are off about 25% from their highs, but housing starts are only off about 10%. Until we see starts dropping down below a 1.5 million annual pace, the vacancy problem will continue to grow.

Eventually, however, builders will slow construction to the point that demand can catch up with supply. This will have a chilling effect on the economy, as it did in the 1990 to 1992 period. That's just one small example of how the mounting global imbalances of the past 30 years are going to take a toll on the American economy. Many more will be detailed on this blog over time.

Saturday, August 05, 2006

Anatomy of a Housing Bubble

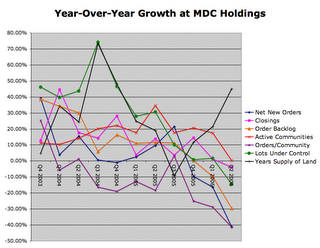
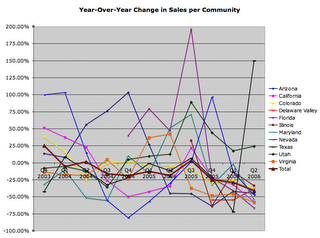
MDC Holdings breaks down their data better than any of the other homebuilders and it tells a story of how the builders got themselves in trouble and how bad things will be in the housing sector going forward. This first chart shows year over year percentage changes for a number of important items:

In 2003, the housing market was booming, thanks to record low interest rates and easy lending practices. MDC was making big profit margins on every piece of land they developed. With rapid appreciation in force, the more they bought and the longer they held land, the larger their profits were. Also, the more they grew the easier it was for executives to justify higher salaries and bonuses. They got caught up in the euphoria and from Q4 2003 to Q3 2004, MDC went on a land buying binge that almost doubled lots under control. What makes sense for executives often runs counter to what makes sense for long term investors and the health of the economy.

The surge in land acquired in 2004 led to a surge in new communities opened in 2005, but new sales and closings grew at a more modest rate during 2004 and 2005 and sales per community actually declined as too many developments came on the market nationally. The quantity of developments increased sales numbers nationally, but an inventory problem was clearly brewing:

After a final surge in Q3 2005, MDC's sales hit a wall in the latter part of Q4 2005 and have tumbled into 2006:

The number of unsold new homes has continued to rise through 2006, as national homebuilders act on plans made when sales were stronger. Regionally, the slowdown hit first in the big bubble areas of California and Nevada had big initial declines, but bounced in late 2005, only to tumble again in 2006. Arizona has been in a steady decline since Q2 2005, Virginia's decline started the next quarter and pretty much everything fell off the cliff starting in Q4 2005. (Texas is an aberration because MDC is exiting the region as quickly as they can, and Utah is still living in fantasyland for now.)

Because builders have far too many communities under development and land on their books things will continue to get worse. MDC has actually been very conservative compared to most other builders when it comes to land acquisitions. Q3 2006 will provide an especially harsh comparison because of the surge in Q3 2005.

Referring back to the original chart:

MDC began canceling land options and stopped acquiring new land. They've also held off on opening up some new communities to keep costs down. MDC is responding more quickly than most of their peers, but their years supply of land based on sales has taken off because of falling sales. The average national builder went from having about 3 years worth of land under development at normal rates of sales to having 5 or 6 years at extreme rates of sales in a massive land grab (MDC went from about 2 to about 3). As sales decline, that turns into 10 years of supply or more. Pursuing rapid growth strategies was great for short term stock appreciation, but once the bubble started bursting the long term risks were exposed. Builders with too much land and debt on their books won't be able to exit without taking huge losses or will get buried under the weight of their debt burden.

Profits are still high at homebuilders because closings lag new orders and backlog. They also capitalize much of their interest expense, so on their books land is still appreciating even if the market value of the land is tumbling. Q3 and Q4 are usually the biggest quarters for closings, but will be down sharply year over year this time for most builders. Two small builders (Dominion and Levitt) reported losses of the first half of 2006. Beginning in Q1 of 2007, I expect almost all builders to report losses. Dominion may be bankrupt by then, and I expect a string of bankruptcies to follow until finally the supply of housing is back in line with demand.

That could take many years because builders are have been flooding the markets with spec houses and condo towers just as the economy begins slowing. Housing booms and busts typically last about 5 years each. This boom, however, lasted about 10 years and was much larger than any past boom. The resulting bust should be about the same size proportionally:

Friday, August 04, 2006

The economy shed 1,266,000 jobs in July, which normally is a big month for layoffs. Seasonally adjusted the economy supposedly gained 133,000 jobs, but seasonal adjustments don't make mortgage payments. Here's a chart showing unadjusted jobs numbers:

Things to note:
Jobs normally grow slower from July to January.
Jobs started going downhill in 2001, and didn't rebound until 2004.
2004 numbers started using the Birth/Death adjustment to boost totals.

Certain sectors are likely to contract as a result of the rebalancing process, like retail, consumer credit and construction. Areas which saw seasonally adjusted job declines in July include:
Residential specialty trade contractors: -9,300
Motor vehicle and parts dealers: -2,600
General merchandise stores: -8,200
Real estate and rental leasing: -2,900

While many realtors still have jobs, few are making a good living these days. I'm afraid the jobs slowdown is only just beginning, and people without jobs generally can't make their mortgage payments or buy luxury items. Defaults were already rising based on interest rate resets, but jobs losses traditionally have a much larger impact.

Here's a chart of M1 money supply, which roughly measures the money that people intend to spend soon:

The portion of money in people's pockets (and checking accounts) has begun contracting. Normally this money grows steadily with inflation and population. The inflation adjusted number gives a crude estimate (-0.5% adjustment per month) of what is really happening to the accounts of the average American. People are getting squeezed and this will ripple through the entire economy over time.

Thursday, August 03, 2006

The Middle-Class Squeeze
Many middle-class Americans have been facing tighter budgets as food, energy and housing costs have been rising faster than their income. Democratic strategists are catching on to this and using it as a campaign theme, but they aren't explaining the root cause of the squeeze, which is the rebalancing process. Voters don't want to be told the part about how they have been consuming too much and saving too little. They'd rather hear the part about how Republican policy makers have been squeezing the living standards of the middle-class in order to boost the living standards of the rich. While the second part is valid, it doesn't diminish the importance of the first part.

Over Consumption
On average, Americans consume far more resources than the rest of the world. As a nation we most likely got in the over-consumption habit by having a great deal of productive land at our disposal with a relatively small population. Later, our economic and military dominance enabled us to exploit the resources of many developing nations. Recently, American over-consumption has come as a result of our taking on massive amounts of debt and selling off productive assets to foreigners at a rate of over $1 Trillion every two years. With consumption on the rise in developing nations, and America's financial and military influence on the decline, the level of consumption in the United States is likely to decline substantially in coming years.
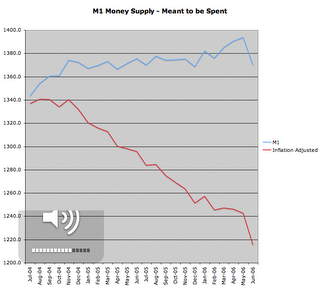
Forced Reduction of Consumption
If Americans could become savers again, the rebalancing process could proceed without a forced reduction in consumption. Culturally and psychologically, that isn't going to happen. People aren't likely to voluntarily reduce consumption just because it is an economic inevitability. Most people will be forced to reduce consumption as a result of a decline in purchasing power in a changing economic landscape. Two of the main ways that this is likely to occur have already begun having an impact on American consumers. The rising cost of essential goods, like food, energy and housing, cuts into the quantity and quality of goods people can consume and greatly reduces their ability to buy non-essential items. Rising interest rates place a further burden on discretionary spending by increasing monthly expenditures for Adjustable Rate Mortgages and consumer debt service. Two additional factors that will lead to an even sharper decline in consumption have not yet begun and are currently prolonging the period of over-consumption. Easy access to credit from private banking institutions and record federal deficit spending have helped many Americans temporarily keep up high levels of consumption at the expense of their wealth and financial security. Viewed independently, all four of these areas might appear to to be short term, unrelated factors, but viewed in the context of a necessary decline in American consumption it becomes apparent both how closely they are all related, and why their convergence means we've reached an inevitable turning point that has marked the beginning of a long period of declining standards of living.
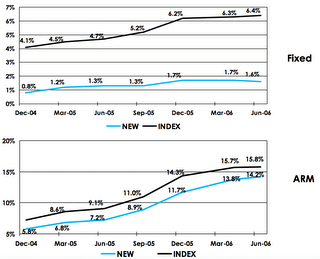
Who Gets Hit the Hardest?
Demographically speaking, the American middle class is responsible for the largest portion of discretionary spending and should therefore face the greatest decline in living standards. There are many poor, but their ability to decrease consumption without dying is less. The wealthy consume a great deal more, but their numbers are few and raising taxes isn't likely to slow their consumption much. Dividing the economic pie is a political game and there is little doubt that wealthy Republican supporters have been spared much of the pain as there people have been in control in Washington. Asset prices have soared while corporate profits and executive salaries have grown rapidly in the first part of this century. Meanwhile, working class and poor Americans have been taking on a disproportionate share of the pain as rising expenditures for heating, transportation, housing and debt service have cutting into already tight budgets. Going forward, there is likely to be much more pain to share (especially from rising energy costs) and political change is possible if there is enough outrage over declining living standards for middle and working class families. Whether or not the political focus shifts to providing a better safety net for the poor while raising taxes on the wealthy, the continuing Middle Class Squeeze will be necessary to reduce American consumption to ecologically and financially sustainable levels.

The following chart was provided today by New Century Financial, America's second largest sub-prime lender:

It shows delinquencies of 60 days or more for ARM and fixed rate mortgages originated in 2003. They boast about their delinquencies being lower than the industry averages, but the sharp rise up to 15% indicates conditions are rough for a rapidly growing segment of the population, and the ARM reset cycle is only just beginning. The pressure of the middle-class squeeze is causing one borrower after another to financially implode.

Wednesday, August 02, 2006

The Rebalancing Trade

For over a year, I've been structuring my portfolio around what I think of as "the rebalancing trade." Most hedging strategies involve some type of trade where the goal is to profit on differences between two types of asset classes. In merger arbitrage, one company will be shorted and another held long as a way to bet on whether or not a merger will go through. In the carry trade, short term bonds are shorted (or money borrowed at short term rates) while long term bonds are purchased as a bet that interest rates will stay constant or go down. In the rebalancing trade, I short US companies that depend on excessive US consumption and go long on foreign companies that are likely to profit from increased consumption overseas, especially in China. My bet is that US consumption must decline relative to international (and especially Chinese) consumption.

With most hedging strategies, there is very strong correlation between the components of the trade. While one might expect a high correlation between foreign and domestic consumer cyclicals, I've found that the correlation hasn't been very strong and that there have been days and periods where the trade has either worked very well or very poorly. I suspect there is a large amount of hedge fund activity in the rebalancing trade in one form or another, and that many funds play somewhat related trades, hedging inflation (foreign currencies, gold and other commodities) against US stocks. Many hedge fund managers do understand the inevitability of global rebalancing, even if the mainstream economic news totally misses the issue. I suspect the activity of momentum oriented and leveraged players in the trade are largely responsible for the low correlation between certain classes of foreign and domestic stocks in recent months.

Recently the rebalancing trade has been working very well. Builders have been trending down for about 9 months, but mortgage lenders and retail joined the fall the last couple of months. On the other side, China has been outperforming most other global equities markets.

The gold bug websites tend to focus on total market liquidity, usually ranting against the excessive use of liquidity. I don't worry about that as much, but I see the world's central banks trying to make the global rebalancing process go as slowly and painlessly as possible. The air is being taken out of the US economy slowly now, which is why the rebalancing trade has begun to work well. I see the rebalancing trade working successfully for a long time, with traders piling in out in front of the central banks, forcing them along a little faster than they'd like to go.

I do not encourage others to try the rebalancing trade for themselves. For one thing, I believe the markets are rigged to take advantage of people's natural tendencies. If you can't trade objectively and cautiously, you'll likely get taken to the cleaners. For another, when too many people are shorting stocks they can be manipulated to take advantage of those shorts. I'd rather not invite manipulation in the stocks I trade or have to compete with others in searching for shares to borrow and short.

I think that most people should try to stay out of the market entirely. It is much better to pay down your debt than to carry a large mortgage along with exposure to the markets. Nothing is really safe in today's markets. As I've mentioned elsewhere, there is a potential for massive defaults in the banking sector because of extreme risks taken through the derivatives markets. Short term treasuries will probably avoid default for a few years, but the US government will not be able to make good on all of its promises in the future. Even money market funds are vulnerable to default if enough of the underlying short term bonds end up being worthless.

It's probably best to keep your debts low and enough cash available in savings accounts to get your through a few months of hard times if the job market suddenly heads south. If things really get shaky in the financial markets, then it could pay to move a large chunk of cash our of the bank and into your mattress.